
Business

tonnes
tonnes
tonnes
tonnes
excl. VAT
excl. VAT
excl. VAT

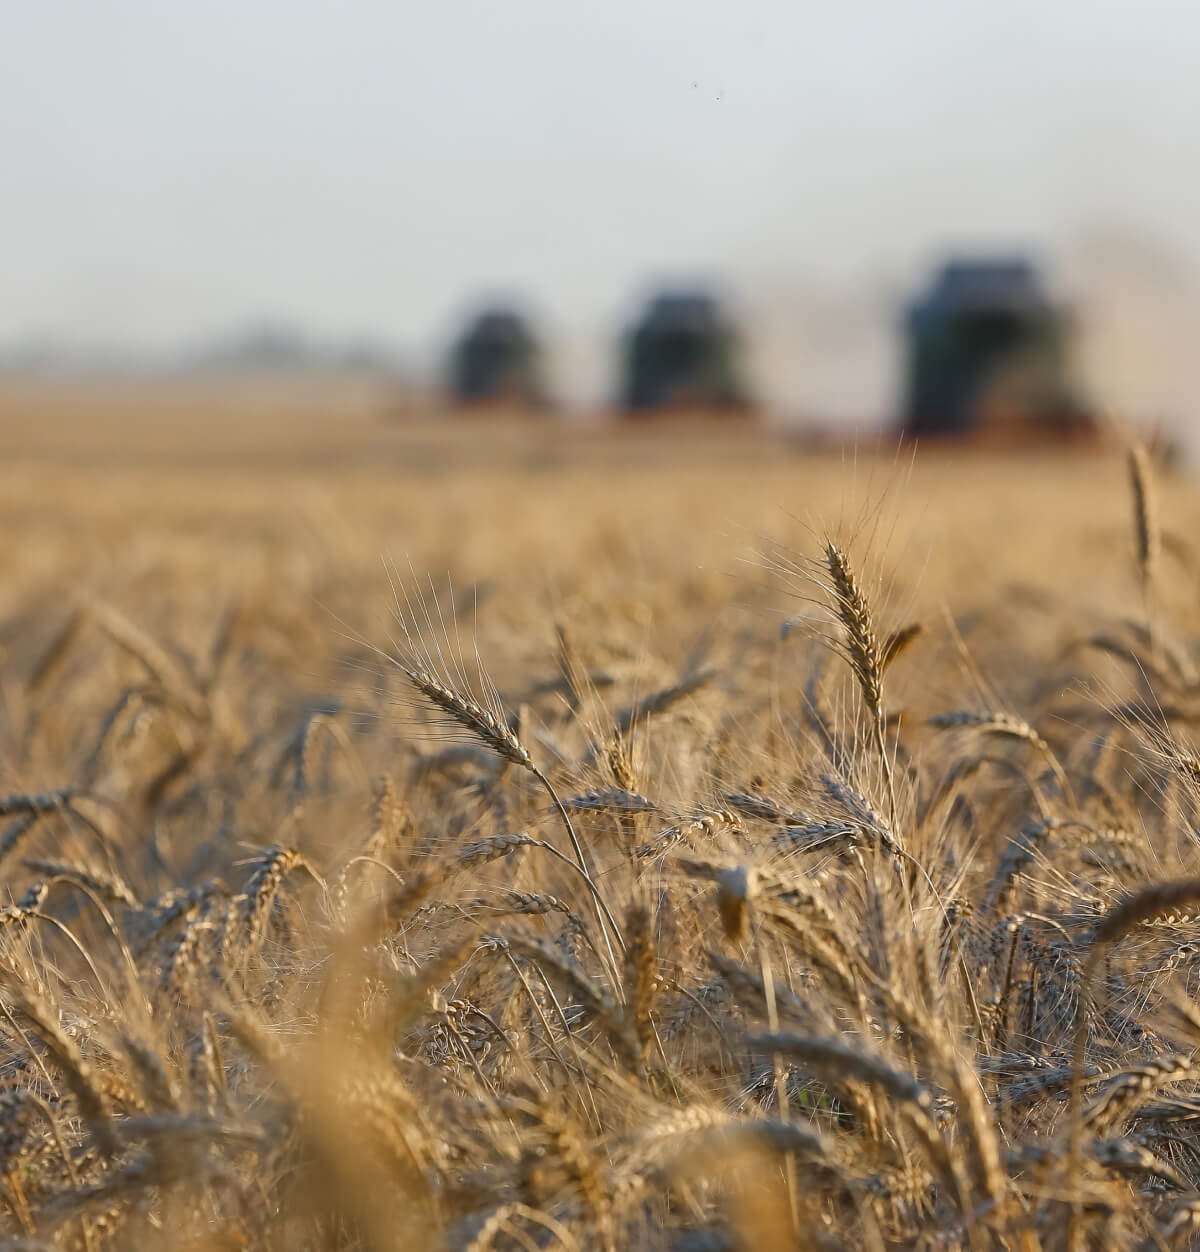
Preliminary data from Rosstat (the Russian Federal Service for State Statistics) for the 2023/2024 season indicates that the grain harvest was 142.5 million tonnes, down 10% (−15 million tonnes) on the previous season. The gross wheat harvest was down 11% (−11.5 million tonnes) and barley was down 10% (−2.2 million tonnes). This was primarily due to lower crop yields. The lower yields were caused by weather conditions less favourable than in 2022, when the grain harvest hit record levels.
The area under cultivation of corn fell by 7% in the 2023/2024 season, resulting in a 9% drop in the gross corn harvest (−1.4 million tonnes), which at the end of the year stood at 14.4 million tonnes. Meanwhile, the corn yield was good, up 14% (+0.9 tonnes/ha) on the previous year.


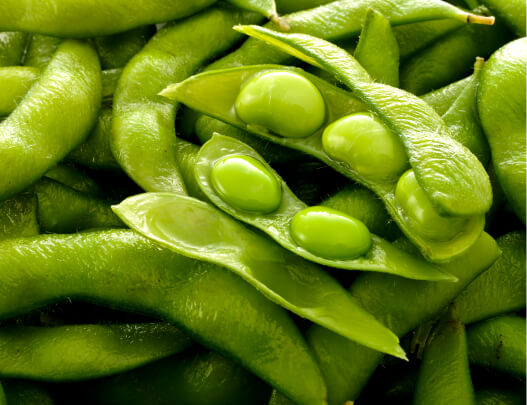
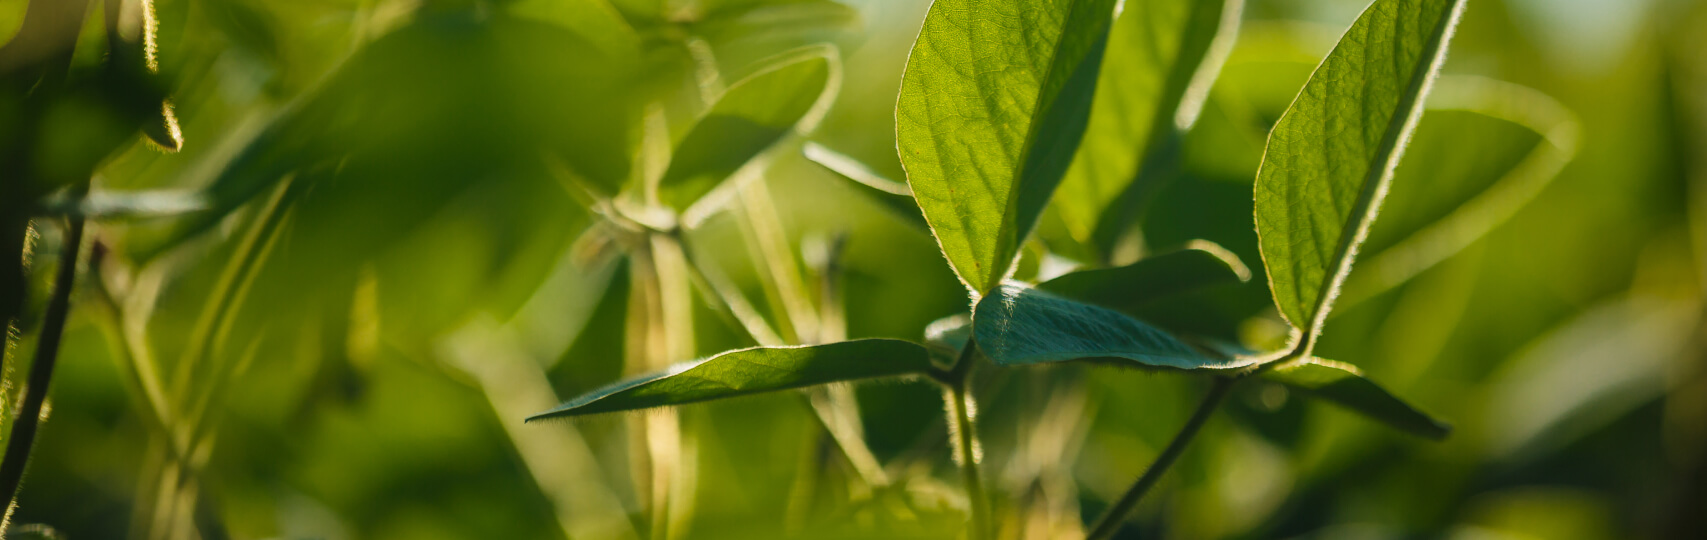
Preliminary oilseed harvest data in the 2023/2024 season points to a 3% increase (+0.8 million tonnes) to 27.6 million tonnes. There was a significant increase in the soybean harvest, up 12% (+0.7 million tonnes) to 6.7 million tonnes. This was due to an expansion in the area under cultivation (+4%) and improved yield (+8%). The area under cultivation of sunflower fell by 3% (−0.3 million hectares) on last season to 9.9 million hectares.
The area under cultivation of oilseed fell by 1%, as some producers believed there were additional risks in switching to domestically produced sunflower seeds under import substitution programmes, and foreign seeds were difficult to import into Russia at the beginning of the year.
Overall, oilseed yields in 2023 were up 4% from 2022. This is due to higher yields in 2023 of sunflowers in the southern region and soybeans in the Central Federal District.


Preliminary data indicates that in the 2023/2024 season, the sugar beet harvest stood at 46.5 million tonnes, which is 5% less that in the previous season (−2.4 million tonnes). Due to unfavourable weather conditions (a consequence of intense rainfall) in the early growing season, yields fell by 1% (−0.4 tonnes/ha) to 48.3 tonnes/ha. The slight increase in the area under cultivation of sugar beet (+4%, or 40 thousand hectares) was driven by favourable market conditions.


According to the audit and consulting company BEFL, as of August 2023, 4.4 million hectares of agricultural land was under the control of five major landowners. Over the year, they increased their land holdings by 313 thousand hectares (+8%). Russia’s largest meat producer, Miratorg, tops the list with an estimated land holding of 1,105 thousand hectares. Rusagro is ranked fourth with a land holding of 670 thousand hectares. As of the end of 2023, the Company managed 685 thousand hectares of land, which will be taken into account in the August 2024 ranking.

In 2023, exports of the major agricultural crops stood at 66.2 million tonnes, up 9% (+5.4 million tonnes) on 2022. Wheat and barley exports were up 7% (+3.4 million tonnes) and 9% (+0.5 million tonnes) respectively. This result was achieved amid expectations of a second record-breaking grain harvest, large carryover stocks, and high export volumes in the first half of the season. Wheat accounts for the bulk of exports. Ongoing work to build and optimise logistical links with importing countries contributed to the increase in exports.
Soybean and sunflower make up an insignificant share of exported agricultural products. In 2023, exports grew by 1% due to an increase in soybean shipments (+1%, or 0.02 million tonnes), while sunflower exports remained unchanged from last year at 0.03 million tonnes. The main limitations on the export of agricultural products from Russia are: the introduction of export duties on niche crops (peas, lentils, chickpeas, linseed, soybean oil, etc.), high duties on oilseeds (20% but not less than 100 USD/tonne on soybeans, 50% on sunflower seeds), and a ban on the export of rapeseed until 31 August 2024 (except at the Zabaikalsk border crossing). In addition, export growth is hampered by pricing policies in importing countries, limited rail transport capacity around ports, and the limited transshipment capacity of Russian ports.


There was virtually no change in the major importers of grain from Russia in 2023, but due to the restructuring of logistics chains, there was a change in the percentage share of importing countries. Turkey, which has traditionally been the largest buyer of Russian grain, saw its share drop from 21% to 15%. The decrease in grain imports by Turkey is due to substantial stocks carrying over from 2022. Egypt’s share fell from 14% to 12%. Bangladesh, on the other hand, grew its share significantly from 3% to 7%, driven by a 184% increase in shipments. There was a substantial increase in Russian grain shipments to Azerbaijan (+49%) and EAEC countries.

The main crop imported to Russia is soybean, with 1.45 million tonnes imported in 2023, down 3% (−50 million tonnes) on the previous year. With the growth in the oilseed yield in Russia, soybean and sunflower imports are falling. This drop is also a result of the breakdown of traditional logistics chains and sluggish establishment of new ones.
As a result, the volume of soybean purchased from Paraguay fell by 305 thousand tonnes to zero, and from Argentina by 6 thousand tonnes (−10%). At the same time, Russia increased its soybean imports from Brazil by 266 thousand tonnes (+24%), which amounted to 94% of the total volume of imported soybean. These factors also had an impact on grain shipments, which fell by 14% to 250 million tonnes.


After peaking in 2021, the annual average price of grain and oilseed fell in 2022–2023. In 2023, wheat prices fell by 15% (to 10.9 thousand RUB/tonne), barley prices by 24% (to 9.7 thousand RUB/tonne), and corn prices by 20% (to 10.5 thousand RUB/tonne). The strong grain harvest in the current season both globally and in Russia contributed to this drop. The grain market is also under pressure from record carryover stocks from the previous season and declining consumer spending power both at home and abroad. On the export market, supply exceeds demand. To stabilise domestic prices, the Ministry of Agriculture decided to purchase grain for the state intervention fund from December 2023, a move that was not previously contemplated.

in Russia (excl. VAT)
in Russia (excl. VAT)
in Russia (excl. VAT)
Following the record-breaking year of 2021, due to the impact of the upward trend in the gross oilseed harvest and the volatile exchange rate, soybean and sunflower prices in 2023 continued to fall for the second consecutive year by 14% (to 32.6 thousand RUB/tonne) and 27% (to 24.3 thousand RUB /tonne), respectively. The more significant decline in sunflower prices was additionally driven by lower export prices for sunflower oil and weak importer trade activity.
in Russia (excl. VAT)

Meanwhile, sugar beet prices again showed an upward trend. Sugar beet prices hit a record low in 2019, but beginning with the poor harvest in 2020, prices for this crop have risen for four years in a row in line with the price of sugar. According to preliminary data from Rosstat, in 2023, the market price of sugar beet reached a new record high, up 12% to 4.5 thousand RUB/tonne.
in Russia (excl. VAT)


bn

bn

tonnes

ha

The total area of land under Rusagro’s management as of yearend 2023 grew by 25 thousand hectares (+4%) to 685 thousand hectares. This growth was primarily driven by the acquisition of land near sugar mills in the Belgorod, Kursk, Orel, and Tambov regions, in Primorsky Territory, and in Saratov, and the conversion of fallow and deforested land into arable land.
Arable land accounts for 87% (+1%) of the Company’s total land under management. The main hindrance to the expansion of land holdings remains the overheated market. Land prices are not falling, as there is strong competition among the major players in the agricultural sector, even though the price of agricultural products is falling and the profitability of the agricultural sector is declining.


Rusagro invested RUB 8.4 billion in developing and maintaining its Agriculture Business in 2023, up 143% on the previous year. A significant portion of these funds was used to purchase a BioTekhnologii grain elevator, expand the fleet, replace outdated agricultural machinery, and deploy irrigation systems.

of beet
and grain harvesters

and mounted agricultural machinery


In 2023, the strategy’s objectives were accomplished through the development and implementation of six key planning algorithms for business operations and AI agromonitoring and surveillance solutions for finished product logistics. The Dmitrovsky elevator was automated to streamline the handling and storage of finished products. This was a pilot project in the elevator automation process for Rusagro’s Agriculture Business. In 2023, the Company plans to develop a mathematical model for the optimal location of elevators, and to continue automating elevators to improve their reliability and increase productivity.
The Field History project kicked off in 2023 to replace foreign digital twin software with a Russian product integrated with key business operation planning algorithms, which will increase the operational and strategic efficiency of our management systems.

planning


As part of a project to improve soil health, in 2023 studies were conducted on soil treatments jointly developed by Rusagro and Peoples’ Friendship University of Russia. Analyses of soil samples taken from land plots where the treatments were applied were carried out at the Agroplem laboratory. The study is being expanded to involve staff from Belgorod State Agricultural University and Voronezh State Agricultural University.
As part of the implementation of Resolution of the Government of Belgorod Region No.249-pp adopted on 25 April 2022, projects to develop an adaptive landscape farming system were rolled out across an area of 130 thousand hectares. As part of these projects, measures were developed on meadow and forest reclamation and the removal of highly eroded areas from the arable land area, and science-based crop rotation was recommended.
In 2023, 113 new varieties of soybean, winter and spring wheat, and sugar beet and sunflower hybrids of foreign and domestic varieties were variety tested at the agronomic test site. The best of these varieties and hybrids were recommended for production.
As part of the Biologisation of Agriculture project, the effectiveness of biological products for plant protection was assessed, efficient and cost-effective approaches to conducting breeding experiments were selected, and experience was gained in the treatment of crop residues for decomposition.
In studies of the effectiveness of crop protection methods, 155 treatments for chemical plant protection, plant nutrition, and plant growth were tested, and the most effective and economical of these were recommended for production.
The second stage of research on soybean breeding for Primorsky Territory conditions, which is being carried out jointly with the Federal Scientific Center of Grain Legumes and Cereal Crops, was completed. Promising soybean lines were identified for transfer to the state variety testing institution.
As part of the Soil Fertility project, in 2023 soil and agrochemical surveys were carried out over an area of 86.9 thousand hectares, and a routine agrochemical survey of arable soils took place over an area of 106.1 thousand hectares. Based on the data obtained, terms of reference were drawn up and differentiated mineral nitrogen fertilisation was carried out on an area of 33.6 thousand hectares to make the use of mineral fertiliser more efficient.
As part of this project, we are generating soil and climatic databases to facilitate the science-based calculation of fertiliser doses and planned yields in order to implement and improve our strategic planning algorithm.
Acidic soils over an area of 30.7 thousand hectares were chemically improved in order to increase soil fertility and crop yields.
Rusagro’s harvest for the reporting period was 6,306 thousand tonnes, up 1,006 thousand tonnes (+19%) on the previous year. This was largely attributable to the increase in the gross sugar beet harvest, with other crops varying in their performance.
The gross wheat harvest fell by 15% (−128 thousand tonnes). At the same time, yield was 4.9 tonnes/ha (−2%), level with last year. The lack of growth is a result of the reduced share of wheat due to the failure to meet planting targets for winter wheat in the autumn of 2022.
The barley harvest stood at 31 thousand tonnes. In addition, in 2023 malting barley was introduced into the crop rotation in Orel Region. Rusagro did not grow barley last year. Yield for barley came in at the 2020–2021 level.
The figures reveal a decline in the corn harvest, which totalled 150 thousand tonnes (−33%, or 75 thousand tonnes). Yield fell to 3.9 tonnes/ha, which is 50% lower than in 2022. This was due to the extremely unfavourable weather conditions: as a result of a typhoon in Primorsky Territory, pollen was washed away, nutrients were washed out of the soil near the root system, and freezing rain and snowfall in November caused mass crop lodging to occur.
Overall growth was primarily driven by the increase in the sugar beet harvest by 985 thousand tonnes (+25%) to 4,901 thousand tonnes. This was achieved due to a 7% increase in the area under cultivation to 100 thousand hectares and increase in yield to 49.1 tonnes/ha (+20%), in part due to the more favourable weather conditions in the growing season compared to the previous year.
The oilseed harvest was up on the previous year. The gross soybean and sunflower harvest came to 355 thousand tonnes (+52%, or 121 thousand tonnes) and 73 thousand tonnes (+43%, or 22 thousand tonnes), respectively. Soybean yields increased by 37% (+0.6 tonnes/ha) to 2.1 tonnes/ha, while the planted area decreased by 15% due to soil overwatering caused by the typhoon in August and resulting loss of crops. The sunflower yield fell slightly by 0.1 tonnes/ha to 2.1 tonnes/ha (−6%). The sunflower crop was partially damaged due to a prolonged period of precipitation that extended the harvest period, and also by a hurricane in Belgorod and Kursk regions.
In 2023, the area of fallowed fields increased from 23 thousand hectares to 41 thousand hectares (+81%) as a result of the exclusion of areas located in the border zone of Belgorod Region from cultivation due to the risks to employees working in proximity to an active military zone. In addition, the area of fallow lands increased from 11 thousand hectares to 38 thousand hectares due to the acquisition of new land holdings that will be subsequently introduced into crop rotation.

tonnes
ha


In 2023, sales by Rusagro’s Agriculture Business increased by 64% (+2,816 thousand tonnes) on the previous year to 7,232 thousand tonnes. Sales of all major crops increased. Sugar beet sales stood at 5,394 thousand tonnes, up 66% (+2,147 thousand tonnes) as a result of the rescheduling of transportation of the harvest from fields to sugar plants from the end of 2022 to the beginning of 2023 due to unfavourable weather conditions, as well as the sale of a larger volume of sugar beet harvested in 2023 due to higher yields and a larger sowing area.
Grain sales stood at 1,150 thousand tonnes, up 17% (+166 thousand tonnes) on the previous year. Due to a change in the sales schedule, Rusagro supplied 942 thousand tonnes of wheat to the market, up 15% (+125 thousand tonnes) on the previous year. A further 88 thousand tonnes were sold thanks to the trading arm of the business that was launched in 2022 to sell its products, which led to a growth in total grain sales. Having restarted barley cultivation during the reporting period, the Company sold 31 thousand tonnes of this product, including 19 thousand tonnes as part of trading operations. Meanwhile, due to high carryovers, corn supplies grew from 162 thousand tonnes to 177 thousand tonnes (+9%).
The later oilseed harvesting dates caused by the lengthy period of precipitation in the autumn in central Russia pushed the sales schedule from 2022 to 2023. As a result, soybean and sunflower sales grew by 280%, from 171 thousand tonnes to 649 thousand tonnes.
All sugar beet (100%) from the Agriculture Business is sold to Rusagro’s sugar plants. A portion of grain goes to the Meat Business to be made into feed. In 2023, the percentage of sales within the Company fell from 34% to 10% due to the more favourable conditions on the open market when balanced with the Company’s own needs. The share of oilseed supplied to Rusagro’s plants increased from 11% to 24% in order to effectively utilise the Company’s production capacity due to expectations of a shortage of raw materials in the Far Eastern Federal District.


In 2023, Rusagro exported 121 thousand tonnes of agricultural products, which is 41% less than in the previous year. As in 2022, outside Russia the Company focused on wheat, corn, and soybean, which accounted for 100% of its exports. Wheat supplies fell from 144 thousand tonnes to 68 thousand tonnes (−53%) due to lower demand from Rusagro’s traditional export markets and falling prices. Buyers showed less interest in concluding supply contracts, holding out for more favourable conditions, while insufficient logistics infrastructure and higher logistics costs also had an impact.
Poor weather conditions had a negative impact on the corn harvest in Primorsky Territory, and this was the main reason for the drop in exports from 38 thousand tonnes to 33 thousand tonnes (−13%). Oilseed exports in 2023 remained at 2022 levels as the recovery of the pig-breeding business in China enabled the Company to maintain soybean exports at 19 thousand tonnes.


tonnes
After the lacklustre results of 2022, Rusagro’s Agricultural Business posted record growth in 2023. Despite the slight drop in prices for all Rusagro’s crops, except corn and sugar beet, there was a significant growth in sales, with revenues totalling RUB 56.9 billion, up 78% (+RUB 25 billion) on the previous year.
At the same time, revenue from the export of agricultural products increased by 3% (to RUB 1.7 billion). Business profitability remained at almost the same level as last year and stood at 30% (−0.7%). Adjusted earnings before interest, taxes, depreciation, and amortisation (EBITDA) rose by 74% (+ RUB 7.2 billion) to RUB 17 billion.


bn
bn

Business and NMGK

tonnes
tonnes
tonnes
tonnes
RUB/t
tonnes
tonnes
USD/t
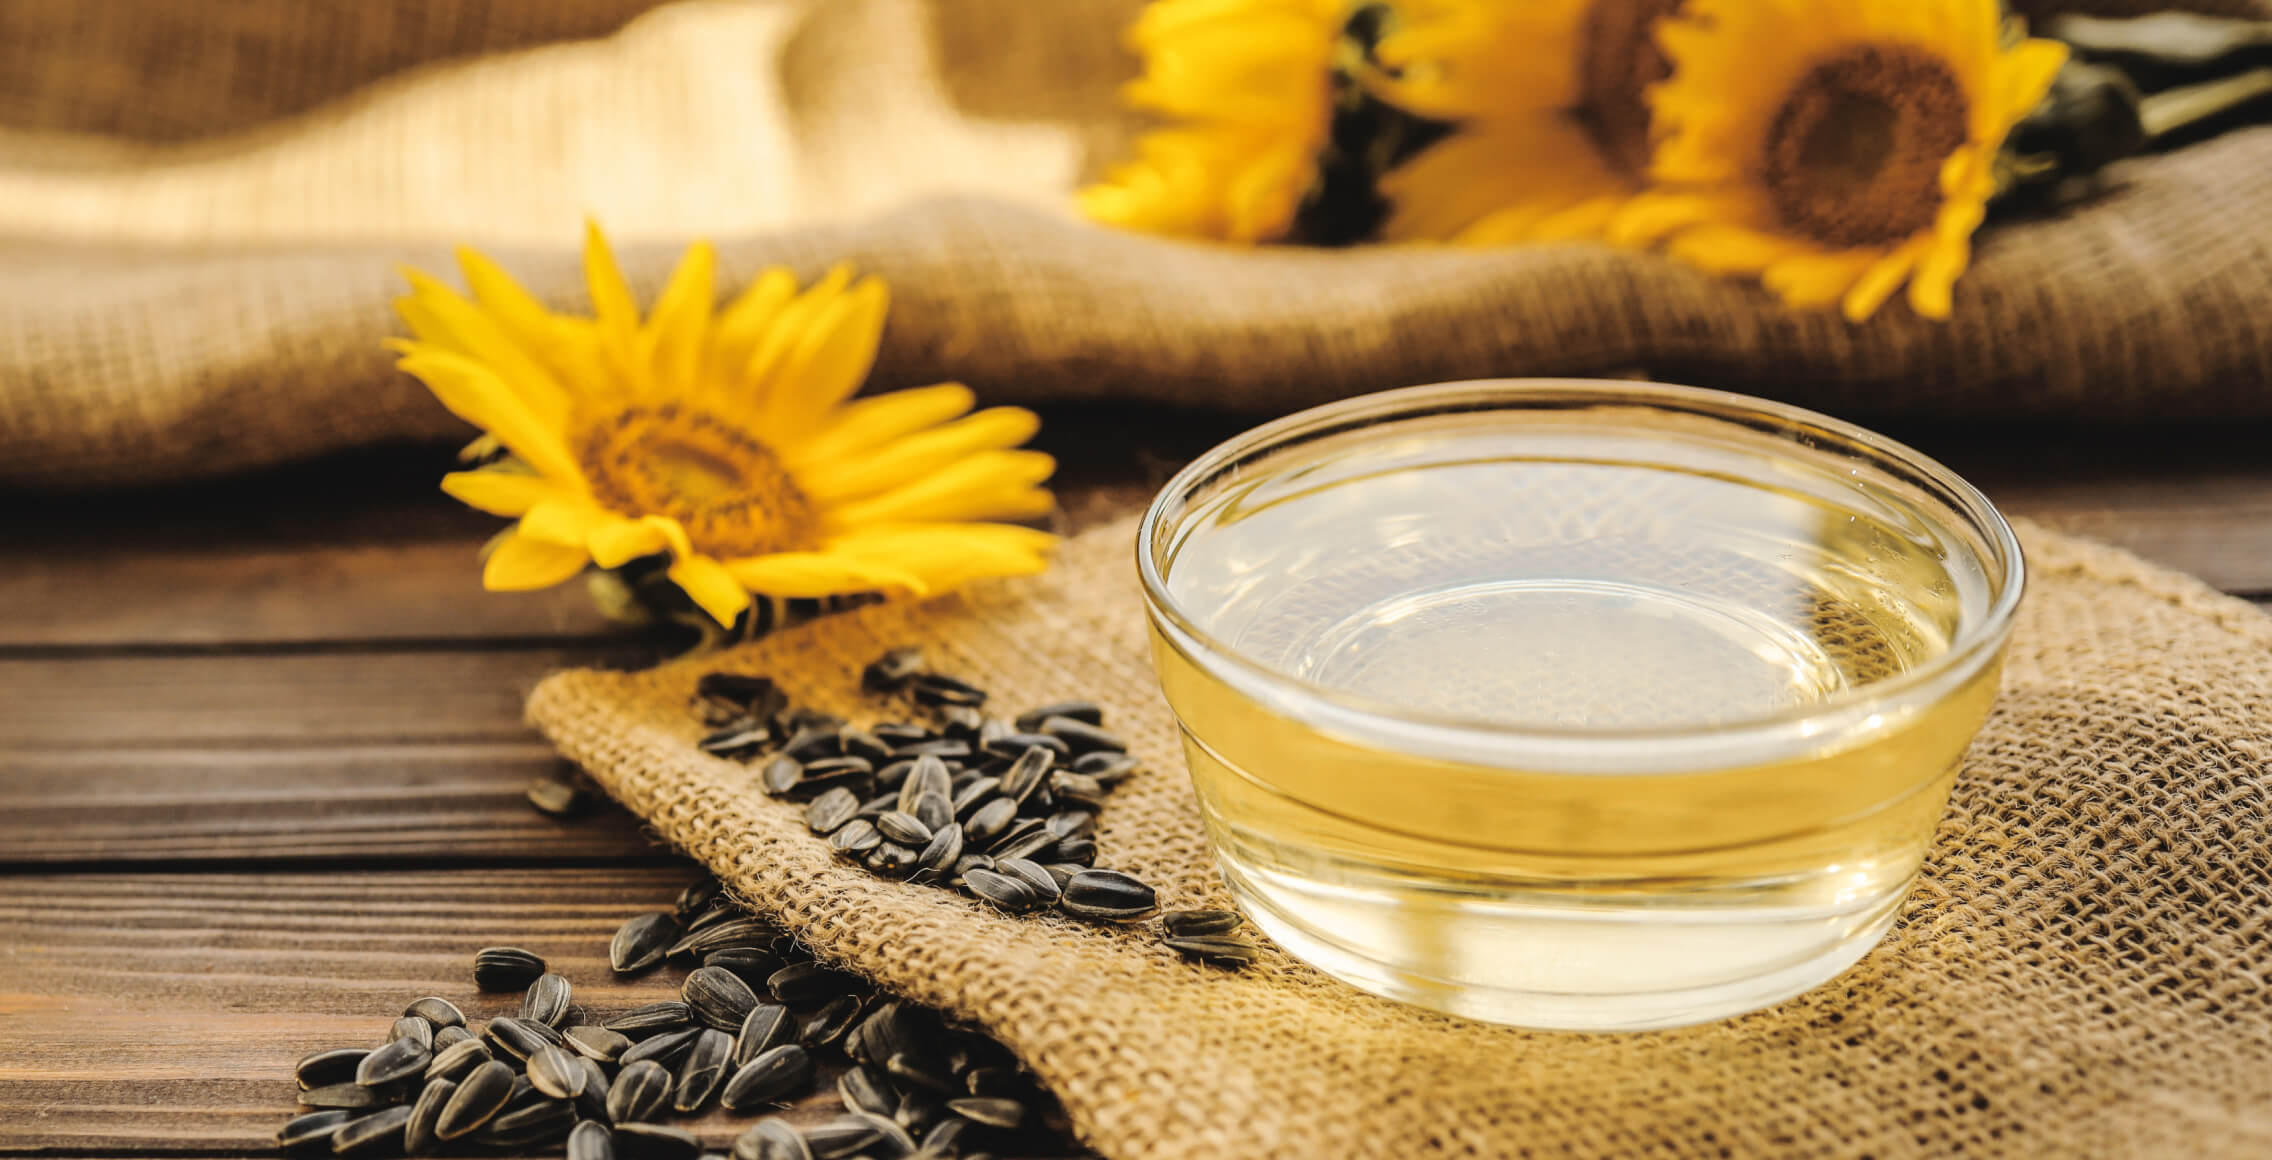
Vegetable oil production increased by 19% in the 2022/2023 season, reaching 9.1 million tonnes. Growth was driven by sunflower oil output, which increased by 12% to 6.6 million tonnes as a result of the bigger sunflower harvest in 2022 (up 5% on 2021). Russia produced 6.9 million tonnes of sunflower oil in 2023, up 13% on the previous year.

Industrial fat production in Russia in 2023 rose by 18% to 1,492 thousand tonnes. Russian industrial fats manufacturers increased their output due to the recovery in the manufacturing of finished products (confectionery products, frosting, fast food, etc.). As a result, Russia saw production increase in virtually every category of industrial fats (except all-purpose hard margarines and specialist all‑purpose fats, which fell by 24 thousand tonnes and 34 thousand tonnes, respectively). The biggest increases were in specialist confectionery fats (+133%), cocoa butter equivalents (+128%), and frying fats (+112%). The increase in production of cocoa butter equivalents was driven by the departure of foreign manufacturers from the Russian Federation and the growth in domestic manufacturing of these products.


 Including margarines for puff pastry and specialist margarines.
In 2023 there was an upward trend in the production of all the main categories of consumer oil and fat products in Russia except packaged margarine. The 16% drop in the production of packaged margarines was caused by a fall in consumer demand for margarine in Russia, with consumers switching to alternative products. Packaged vegetable oil output increased by 36 thousand tonnes (+2%) to 1,917 thousand tonnes. This was driven by an increase in export volumes coupled with only a slight reduction in the size of Russia’s retail market for sunflower oil. Production of mayonnaise and mayonnaise-based sauces increased by 62 thousand tonnes (+8%) to 872 thousand tonnes in order to replace imported products of this type. There was similar growth (+9 thousand tonnes, or 8%) in spreads.
Meanwhile, the production of consumer dairy products increased across all major categories, with the exception of margarines and spreads (−2%). The whole and skimmed milk powder category experienced the most growth. Output of these products increased by 7% (+15 thousand tonnes) to a record 224 thousand tonnes. The increase in production of whole and skimmed milk powder was driven by an increase in state support for the dairy sector overall (up by 9% on 2022). In the biggest category, cheese and cheese products, output increased by 1% (+14 thousand tonnes) to a record 1,155 thousand tonnes. The strongest growth of all was seen in hard cheese (+22 thousand tonnes, or 13%) and semi-hard cheese (+34 thousand tonnes, or 11%). This upward trend was driven by an increase in people’s real disposable income and the stabilisation of prices for dairy products overall, including cheese and cheese products.


The production of bar soap in Russia increased by 7% in 2023 to 128 thousand tonnes. Bars of toilet soap accounted for 61% (or 78 thousand tonnes). Toilet soap production rose by 13%, largely due to the emergence of small manufacturers. Laundry soap production, meanwhile, continued to fall for the fourth year running due to consumers switching to more modern laundry and homecare methods, and totalled 50 thousand tonnes.

Five major players accounted for about 37% of crude sunflower oil production in Russia in the 2022/2023 season. Estimates by the Oil and Fats Union and the Company place Rusagro as the leading manufacturer, with a market share of 12.3% (here and below including NMGK’s consolidated results in 2023). Rusagro and NMGK’s combined output totalled 813 thousand tonnes (+32%). Yug Rusi ranked second, with a market share of 9.8%, and EFKO is in third place with an estimated share of 7.2%.
 Including NMGK.
Three major players accounted for 98% of Russia’s industrial fats market in 2023. The market leader is EFKO, with an estimated 59% (−1 percentage point) of the Russian industrial fats market in 2023. Rusagro together with NMGK remained in second place, increasing their market share to 30% (+6%). As ever, Cargill was in third place and its market share remained at 9.5%.
 Including NMGK.
Five players account for more than half (61%) of packaged vegetable oil output in Russia. The largest is Yug Rusi. As this company does not belong to the Russian Oil and Fats Union, Rusagro carried out an expert assessment and estimated its output at 509 thousand tonnes and its share of Russian production at 27% (−1.2 percentage points). Rusagro is ranked fifth, with a 5% share (−0.2 percentage points).

Rusagro has been Russia’s leading producer of consumer margarine for many years. NMGK has historically taken second place. In 2023, following the acquisition of a 50% shareholding in and control over NMGK, the combined market share of the combined business of the two companies in this product category is estimated at 65% (+6 percentage points), or 44 thousand tonnes. In second place, well behind the leader, with a share of 6.5% (+2.9 percentage points), is EFKO, which produced around 4 thousand tonnes. In third place is Yanta, which produced 3 thousand tonnes of consumer margarine and has a 4.5% (+0.4 percentage points) market share. The main trend in this segment was less distribution through key commercial networks and growth in the own brand category.
 Including NMGK.
Five major manufacturers account for 86% of the mayonnaise produced in Russia. In 2023, following Rusagro’s acquisition of control over NMGK, the combined business became the market leader for mayonnaise, with Rusagro and NMGK’s combined market share at 38% and output at 298 thousand tonnes. In second place is Essen, with a share of 19% and an estimated 153 thousand tonnes produced.
 Including NMGK.
Five major players accounted for 64% of the toilet soap produced in Russia in 2023. NMGK and Rusagro regained their position as the country’s leading producers: in 2023, the combined companies occupied an estimated 16.4% (−0.3 percentage points) of Russia’s soap market. The perfume and cosmetics company Vesna slipped down to second place, its market share having dropped to 16.2% (2.7 percentage points less than last year). In third place is EFKO-Kosmetik, although its share increased by 1.8 percentage points to 13.8%. Nevskaya Kosmetika had the fourth-largest share with 11.7% (−4.6 percentage points), and Nefis Cosmetics came in fifth, its market share having fallen from 8.8% to 6.2% (−2.6 percentage points). Among laundry soap manufacturers, NMGK and Rusagro jointly rank second, with a market share of 21.3%. EFKO is the market leader, having increased its share to 31.8% (+4.8 percentage points).
 Including NMGK.
Due to increased vegetable oil production in Russia in the 2022/2023 season, bulk crude vegetable oil exports were up 39% on the previous season to 5.7 million tonnes. Vegetable oil exports are forecast to increase further in the new season to 6.7 million tonnes, including 3.7 million tonnes of sunflower oil, due to anticipated growth given an improved oilseed harvest based on harvest figures as they stand in early 2024.
Turkey, Iran, China, and India have been the main buyers of Russian crude sunflower oil in recent years. In the 2022/2023 season, 22% (+15 percentage points) of all Russian exports went to China and 21% (−6 percentage points) went to Iran.
The share of exports to Turkey fell by 16 percentage points due to a significant increase in supplies of cheaper sunflower oil from Ukraine on the Turkish market. Turkey nevertheless accounted for 18% of exports. There has been a noticeable increase in the share of exports to India, up by 8 percentage points to account for 20% of the total. The share of sales to Egypt has remained unchanged at 7%.
Crude vegetable oil imports fell only slightly to 1 million tonnes (−6%) in the 2022/2023 season as a result of a 37% drop in imports of other oils from 0.2 to 0.1 million tonnes. Palm oil imports into Russia have remained stable over the last few years and remain at a level of about 0.8−1 million tonnes.


In 2023, Russia exported 81 thousand tonnes of industrial fats, down 38% (−50 thousand tonnes) on 2022. This trend was driven by a 68% drop in exports of all-purpose fats (to 21 thousand tonnes), which accounted for only 26% of total exports at year end. The overall decline in exports was caused by the fall in supplies of industrial fats to Uzbekistan to 30 thousand tonnes. Uzbekistan has the most significant share (37%) of industrial fats exports from Russia, mainly all‑purpose fats, but in October a 7% duty on palm oil imports was introduced in Uzbekistan, causing this decline. The main export is milk fat substitutes: 26 thousand tonnes were exported, which is 7% more than in the previous year.
Imports of industrial fats rose by 75% to 113 thousand tonnes, including 80 thousand tonnes (+159%) of all‑purpose fats and 30 thousand tonnes (+4%) of cocoa butter equivalents. About half (49%) of the imports came from Indonesia (56 thousand tonnes, +158%), with another 19% and 10% coming from Malaysia and Latvia (22 and 11 thousand tonnes), respectively.


In 2023, there was a 14% increase in exports of the main categories of consumer oil and fat products from Russia (+84 thousand tonnes more than in 2022).
The sharpest rise was in exports of bottled vegetable oil, up 19% or 82 thousand tonnes to 505 thousand tonnes. The main buyers are Uzbekistan (31%) and Afghanistan (14%). Packaged margarines and spreads, following the trend of moving away from margarine consumption, fell by 14% or 12 thousand tonnes. Exports in this category totalled 72 thousand tonnes.
Meanwhile, exports of mayonnaise and mayonnaise-based sauces rose by 14% to 109 thousand tonnes as a result of increased sales to Kazakhstan, Belarus, Azerbaijan, Georgia, and Tajikistan. This was due to migration and a shift in focus for Russian manufacturers’ away from European countries. Another reason for growth was that Kazakhstan has seen an increase in per capita mayonnaise consumption due to population inflows.
The world’s largest importer of the main categories of Russian consumer oil and fat products has historically been Uzbekistan, the main buyer of packaged vegetable oil. In 2023, 159 thousand tonnes (+32% on the previous year) or 31% of Russia’s total exports of packaged vegetable oil went to Uzbekistan.
Kazakhstan is the second-largest importer, being the main buyer of mayonnaise and mayonnaise-based sauces (27 thousand tonnes or 25% of exports in this category) and margarines and spreads (21 thousand tonnes or 30%).
Russia imports a small amount of consumer oil and fat products, mainly olive oil from Spain and Italy. Vegetable oil imports in 2023 stood at 16 thousand tonnes (−11%), including 12 thousand tonnes in total from these two countries. Three thousand tonnes of mayonnaise and mayonnaise-based sauces (−10%) and 3 thousand tonnes of margarine (−59%) were imported. The decline in imports was largely due to logistical difficulties and import substitution by local manufacturers.


32 thousand tonnes of bar soap were exported, partly due to the growth of soap production in Russia in 2023. Toilet soap accounted for 52% of these exports (16.5 thousand tonnes). 15.1 thousand tonnes of laundry soap were exported.
Kazakhstan, Tajikistan, and Belarus are the main buyers of Russian bar soap. In the past year, 36% of the total toilet soap exported from Russia and 28% of the laundry soap went to Kazakhstan. Tajikistan imported 38% of the total laundry soap, and Belarus imported 23% of the total toilet soap.
Imports of bar soap in 2023 totalled 25 thousand tonnes: 21.5 thousand tonnes (68%) of toilet soap, and 3.9 thousand tonnes (12%) of laundry soap.


The average annual price of crude sunflower oil in Russia fell by 16% in 2023 compared to the 2022 average and stood at 65.7 thousand RUB/tonne excluding VAT. The change in market prices over the year was driven by changes in global prices and exchange rate fluctuations.
Meanwhile, the average global palm oil price fell by 30% year on year (to 896 USD/tonne). The price fluctuated by USD 100–150 during the year, but towards December it dropped to 820 USD/tonne.


RUB/t
Manufacturers’ prices for the main categories of consumer oil and fat products went in various directions in 2023.
The market prices for packaged sunflower oil fell by 4% to 88 RUB/kg excl. VAT (following 2022’s several-year high of 92 RUB/kg excl. VAT), while mayonnaise prices fell by 3% to 114 RUB/kg excl. VAT. The fall in vegetable oil prices followed the general trend for crude oil prices. The slight drop in mayonnaise prices was the result of marketing pressure by manufacturers.
Prices for margarines and spreads went up by 4% to 80 RUB/kg and 173 RUB/kg excl. VAT, respectively.
This rise was due to the increase in the dollar rate, which made palm oil more expensive for Russian manufacturers. Rising prices for logistical services contributed to an increase in production costs.
An upward trend could also be seen in the market prices for cheese, cheese products, and butter, which rose by 6%, 1%, and 6%, respectively. Although the cost of raw milk fell (by 7% to 31.8 RUB/kg excl. VAT), the price was supported by growing consumer demand and increased exports of milk-rich product categories (consumer milk and fermented milk products).


The average annual price for toilet soap rose by 4% in 2023 to 432.3 RUB/kg excl. VAT. This was due to an increase in variable costs, which led to a rise in retail prices in shops.


bn

bn


tonnes
tonnes

tonnes
tonnes


- Kalininsk
- Pugachyov
- Samoilovka
- Stepnoye
- Rtishchevo
- Petrovsk
- Saltykovka
- Komsomolsky
- Arkadak
- Khvalynsk
- Balashov
- Balashov Grain Storage
- Yekaterinovka Elevator

- Atkarsky Oil Extraction Plant
- Balakovsky Oil Extraction Plant
- Saratovsky Oil and Fats Plant

- Alekseyevka
- Pokhvistnevo
- Bolshaya Glushitsa Grain Reception Enterprise
- Borskoye Elevator
- Pestravka Grain Reception Enterprise
- Bezenchuksky Oil Extraction Plant
- Koshkinsky Butter and Cheese Plant
- Samara Fats Plant

- Buguruslan
- Totskoye
- Sorochinsk Elevator
- Sorochinsk Oil Extraction Plant

- Uryupinsk Elevator
- Uryupinsk Oil Extraction Plant

- Yekaterinburgsky Oil and Fats Plant

- Primorskaya Soya Oil Extraction Plant and Oil and Fats Plant

- Zavolzhsky Milk Plant

- Nizhny Novgorod Oil and Fats Plant

- Yermolayevo Grain
Elevators
Plants
Oil and Fats Business assets
NMGK assets
Rusagro’s total sunflower processing capacity increased by 13% in 2023, reaching 5.2 thousand tonnes of sunflower seeds per day. In 2023, the Balakovsky Oil Extraction Plant was upgraded, and in November 2023 the plant began producing 2,400 tonnes/day, 33% more than in the previous year prior to the upgrade. It processes 1,609 thousand tonnes of sunflower seed per year. This means around 700 thousand tonnes of crude oil and 610 thousand tonnes of meal can be produced, depending on the oil content of the sunflower and the plant’s performance.
The acquisition of control over NMGK has resulted in Rusagro gaining additional sunflower processing capacity of 757 thousand tonnes per year. The total capacity of the group’s oil extraction plants is now 2,366 thousand tonnes per year.
In addition, Rusagro owns a soybean processing plant in the Russian Far East with a maximum annual capacity of 179 thousand tonnes of soybeans, which yields up to 18 thousand tonnes of oil and 75 thousand tonnes of soybean meal per year.

In 2023, Rusagro’s total annual production capacity was approximately 418 thousand tonnes of industrial fats (up by 2% on 2022 due to the reduction of operational downtimes and improved performance of production lines) and 645 thousand tonnes of consumer products, including around 300 thousand tonnes of bottled oil, 285 thousand tonnes of mayonnaise and mayonnaise-based sauces, and 65 thousand tonnes of consumer margarine and spreads.
The additional capacities that NMGK has brought to the group’s production facilities can produce 70 thousand tonnes of industrial fats and 266 thousand tonnes of consumer products, including mayonnaise and mayonnaise-based sauces (195 thousand tonnes), consumer margarine and spreads (38 thousand tonnes), and toilet and laundry soap (33 thousand tonnes).

Rusagro’s Oil and Fats Business has five elevators with a storage capacity of around 190 thousand tonnes of sunflower. The Company also leases ten third‑party elevators with a storage capacity of 230 thousand tonnes of sunflower. The elevators can also be used to store grain crops.
NMGK’s assets include eight elevators that can store 475 thousand tonnes at any one time. The total storage capacity at the group’s disposal is equal to 895 thousand tonnes.
Rusagro’s estimated milk processing capacity at its butter and cheese plant is 270 tonnes of milk per day. In terms of industrial dry mixes, the total production capacity is 17 thousand tonnes. Milk is purchased from private farms in Ulyanovsk and Samara regions and in Tatarstan. The product range includes cheese and cheese products, butter and spreads, cream, and powdered products. The plant specialises in the production of cheese and cheese products made with rennet. Butter and cream are by-products of this process, as are powdered mixes made from cheese whey.
The product portfolio of Rusagro’s Oil and Fats Business and NMGK has four segments: sauces, liquid oils, solid fats and soaps, and dairy products. The key sauce brands are Ya Lublu Gotovit, Mechta Khozyaiki, Provansal EZhK, Ryaba, Astoria, and Sdobri, while the key margarine brands are Schedroe Leto, Chudesnitsa, and Khozyayushka. Ya Lublu Gotovit is an umbrella brand that incorporates three local brands of mayonnaise (Moskovsky Provansal, Saratovsky Provansal, and Novosibirsky Provansal). Sauces, ketchup, and pasta are marketed under the Astoria brand. NMGK also produces a baby soap, Moi Malysh.
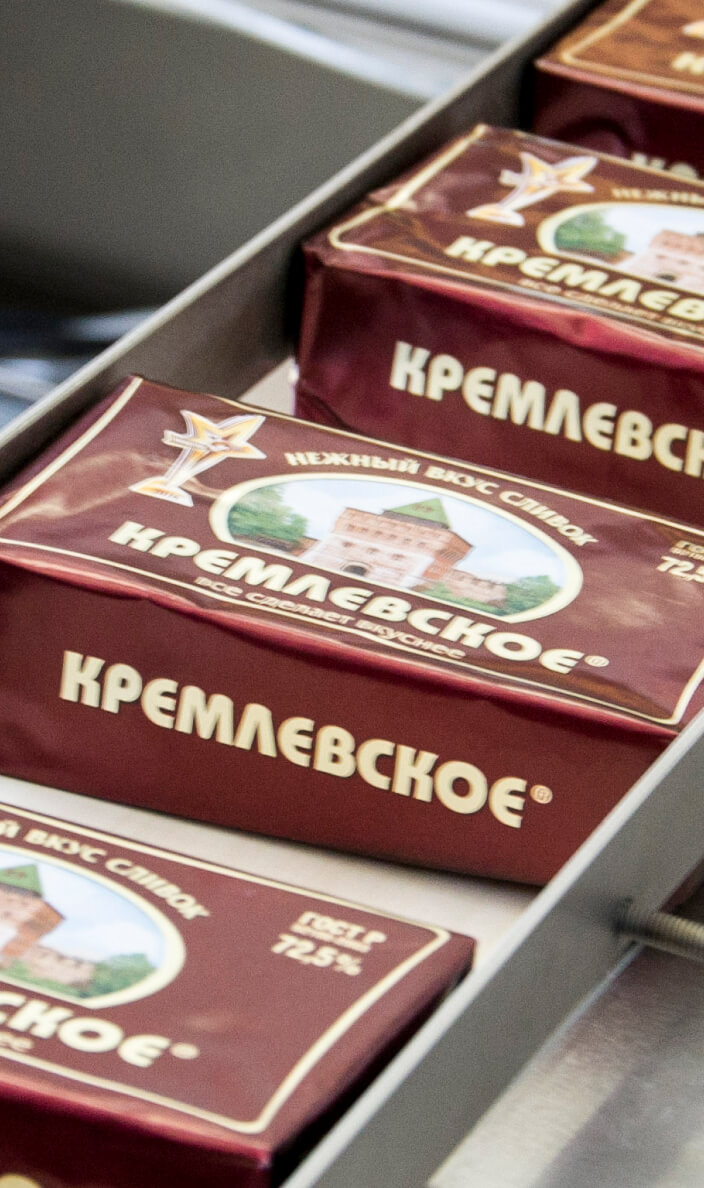
Other brands are: Rossiyanka, Benefitto, Maslava, and Leto Krasno (oils); Saratovsky and Slivochnik (margarines); Zhar Pechka, Buterbrodnoye Utro, Kremlyovskoye and Alpiisky Lug (spreads); Olivyez and Nezhny (mayonnaise); Milye and Syrnaya Kultura (milk products); Khozyayushka Toplyonaya (clarified fat blend); and Delicato (coconut oil). Product innovations: Hungry Panda plant-based drinks. Soap: Retsepty Chistoty, Monpari, Dushistoye Oblako, and Originalnoye.
Following the merging of the business with NMGK, the combined business’s margarine brands occupy around 65% of the consumer margarine market in Russia and its mayonnaise brands lead the market with a 38% share. In Central Russia, the most recognisable brand is Moskovsky Provansal, while in the Urals this is Provansal EZhK and Schedroe Leto margarine. NMGK’s mayonnaises Ryaba and Sdobri hold strong positions in their home markets in Northwestern Russia and the Volga region. Khozyayushka is the leading margarine brand in the Northwestern region. Kremlyovskoye is the most popular spread in Central Russia. Schedroe Leto is also the number one brand exported from the Russian Federation and dominates the markets in Uzbekistan, Tajikistan, and Turkmenistan. Mechta Khozyaiki is the market leader in Moldova and Azerbaijan, while Olivyez is top in Uzbekistan. A special brand, Leto Krasno, has also been developed for the Chinese market.


In 2023, Rusagro invested RUB 3.2 billion in developing and maintaining its Oil and Fats Business — the same level as in the previous year. Overall investment in the oil and fats segment, including NMGK, came to RUB 3.5 billion. Most of the investment went towards upgrading the Balakovsky Oil Extraction Plant and repairing the production site in Ulyanovsk.


- creating a centralised, stable IT systems architecture that can be aggressively scaled up;
- digitalising end-to-end business processes, from the purchase of raw materials (sunflower) to sales of the finished oil and fat products, including all cycles, both core production (processing, production) and ancillary processes (logistics, storage, pricing, customer service, repairs).


In 2021, Rusagro successfully launched its flagship project — the Digital Farmer app. This is a single architectural solution that brings different IT solutions together into one app to automate our work with farmers. By the end of 2023, over three thousand agricultural producers in every region where the Oil and Fats Business operates were using the app. 90% of all purchases are now made via Digital Farmer.
Users believe this additional way of communicating saves them time and makes selling their agricultural products simpler. With this digital service, suppliers can order transport, carry out sales and purchases with a digital signature, exchange information on supplies and professional recommendations, and receive real-time analytics. One of the vital services provided is Agricultural Support, which gives farmers access to professional support in the run-up to sowing, thereby increasing their sunflower yield.
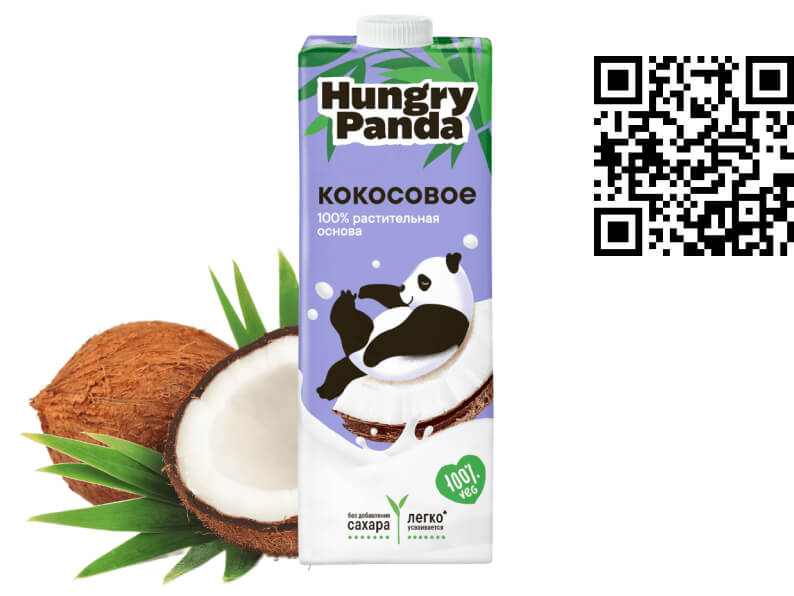
In 2023, R&D at the Oil and Fats Business developed the Hungry Panda brand of plant-based drinks — Oat, Coconut, and Almond — and launched the brand at the Ulyanovsk site.
To create innovative products with improved consumer properties, GrandPro Eclair, a specialist margarine with a 72.5% fat content for making creams, was developed and launched in 2023 in the GrandPro line. In the specialist confectionery fats line, a POP-type cocoa butter substitute was developed and launched. In the HoReCa segment, mayonnaise with a fat content of 67% and 78% was developed for the UAE market.
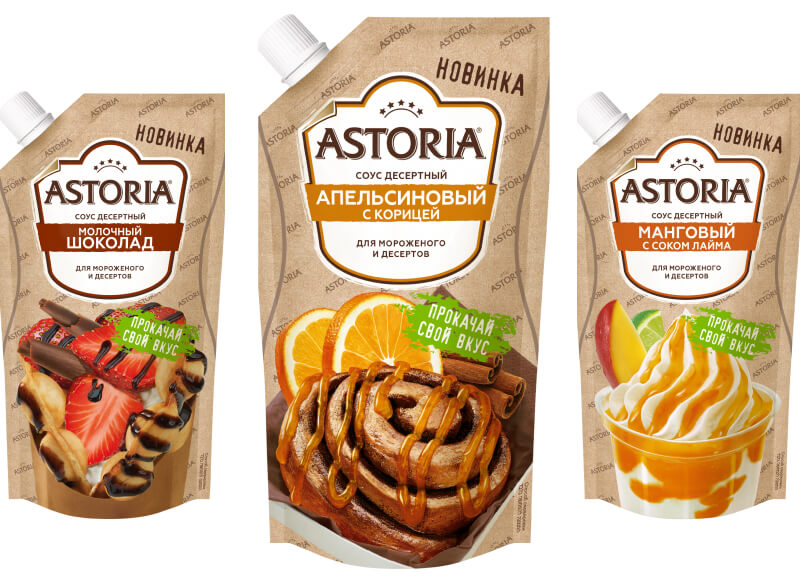
Developments in the FMCG category: a line of dessert sauces for retail; Parmesan cheese-flavoured sauce, Truffle mushroom-flavoured sauce, and Provansal Konoplyany mayonnaise. Developments in the B2B category: a general-purpose fat with a predetermined ratio of short-chain fatty acids close to milk fat, and a premium coconut oil for frying popcorn.
In 2023, Rusagro’s crude vegetable oil production fell by 12% (−78 thousand tonnes) to 563 thousand tonnes. NMGK produced 325 thousand tonnes of crude vegetable oil in 2023. The volume of sunflower seeds processed by Rusagro fell to 1.2 mn tonnes (−16%). The decline in production was caused by a shortage of available capacity in early 2023 due to icy conditions in Astrakhan, as well as the shutdown of the Balakovsky Oil Extraction Plant for upgrading.
In addition to sunflower oil, 72 thousand tonnes of soybeans (+36%) were processed to produce 11 thousand tonnes of soybean oil (+27%). Meal production fell by just 14% to 508 thousand tonnes.
Rusagro produces all the main types of industrial fats, with the exception of cocoa butter equivalents. The bulk of the product range comprises all-purpose margarines and fats, which are the most sought-after products on the domestic market. In 2023, the Company was able to increase its output of industrial fats by 11% to 338 thousand tonnes. There was also an increase in equipment operating effectiveness — operational downtimes were reduced by preheating the line and increasing productivity. NMGK produced 56 thousand tonnes of industrial fats during the reporting period.


Following a reduction in consumer demand for margarine that impacted demand for finished products on domestic and global markets, Rusagro’s output of oil and fat consumer products fell by 2% in 2023 to 296 thousand tonnes (−7 thousand tonnes). Bottled oil production remained virtually unchanged compared to last year, at 104 thousand tonnes (+0.4%). However, production of mayonnaise and mayonnaise-based sauces was up 3% (+5 thousand tonnes), reaching 157 thousand tonnes. One of the factors that contributed to the growth in mayonnaise production was the launch of a line producing sauces in catering-sized buckets. The production of margarines and spreads, however, fell by 25% (−12 thousand tonnes) to 35 thousand tonnes.
NMGK produced 164 thousand tonnes of mayonnaise and mayonnaise-based sauces, 17 thousand tonnes of margarines and spreads, and 20 thousand tonnes of toilet and laundry soap during the period. 200 thousand tonnes of consumer oil and fat products were produced in 2023.


In 2023, sales of Rusagro’s industrial oil and fat products fell by 10% (−127 thousand tonnes) to 1,140 thousand tonnes. There was an upward trend in sales of industrial fats, which saw a 6% increase (+19 thousand tonnes on 2022) to 316 thousand tonnes. This was due to increased sales of all-purpose and confectionery fats and all-purpose margarines. Lower output pushed sales of sunflower oil down by 54 thousand tonnes to 314 thousand tonnes (−15%), while sales of meal fell by 15% to 509 thousand tonnes (−92 thousand tonnes).
Sales of consumer oil and fat products fell by 3% (−9 thousand tonnes) to 292 thousand tonnes. This was due to a 3% decline in sales of bottled oil (−4 thousand tonnes), since potential output was limited by production capacities. Sales of consumer margarines and spreads fell by 22% (−9 thousand tonnes) to 32 thousand tonnes. This was partially offset by growth in the mayonnaise and mayonnaise-based sauces category, where sales increased by 3% (+4 thousand tonnes) to 149 thousand tonnes. The growth in this category was linked to increased sales both in Russia — as a result of the development of the nationwide distribution of Ya Lublu Gotovit mayonnaise and the launch of new sauce categories — and on export markets. The 5% growth in exports was driven by shipments to key countries — Azerbaijan, Kazakhstan, and Belarus.

In addition, NMGK sold 146 thousand tonnes of products in the consumer oil and fats category. Partly thanks to NMGK, the group’s product range has acquired a new toilet and laundry soap category, and the “Other Products” category now includes pasta, coconut oil, and clarified fat blends.


Sales of dairy products stood at 30.4 thousand tonnes, down 3% on 2022 (−1 thousand tonnes). Sales of whey powder mixes, which are used as ingredients in convenience food, as cream powder for instant coffee, and as additives for meat and confectionery products, fell by 17% to 13.6 thousand tonnes. Sales of consumer dairy products rose by 12% to 16.8 thousand tonnes, largely due to the expansion of raw products distribution.
 The Other Products category now includes pasta, coconut oil, and clarified fat blends.
In 2023, the consumer segment accounted for 19% (+1 percentage point) of oil and fat product sales and 33% (+3 percentage points) of the revenues earned by Rusagro’s Oil and Fats Business. Rusagro’s oil and fat products have historically occupied leading positions in their home regions, partly thanks to distribution development, promotions, and new product launches. For example, according to data from AC Nielsen, in 2023 Provansal EZhK mayonnaise was, as before, the biggest seller in the Urals with a 63% market share, while Ya Lublu Gotovit was number two in Central Russia with a 23% market share. According to the results as of December 2023, Ya Lublu Gotovit is one of the top three brands in Russia. Schedroe Leto is the market leader in Central Asia (Uzbekistan, Tajikistan, Kazakhstan, and Kyrgyzstan). Saratovsky and Maslyona are popular in Azerbaijan and other export countries.
NMGK has brought some very strong brands into the group’s portfolio. According to AC Nielsen data on the Russian market in 2023, Ryaba mayonnaise is in third place with an 11.3% market share, Khozyayushka margarine is the market leader with 31.1%, Astoria mayonnaise-based sauce ranks first with 34%, Khozyayushka clarified fat blend leads with 78.2%, and Delicato coconut oil is first with 77.5% of the market. Kremlyovskoye spread is the market leader with 19.8%. The soap brand Retsepty Chistoty also leads with 12.1% of the Russian market.
Astoria sauces are in demand in former Soviet countries (Belarus, Moldova, Latvia, and Georgia). Turning to the Central Asian markets, Kremlyovskoye spread is a big seller in Tajikistan, Kyrgyzstan, and Turkmenistan, and Khozyayushka margarine is popular in Tajikistan.
In 2023, Rusagro successfully launched several new products under the Ya Lublu Gotovit brand — “Domashny”, “Perepeliny”, “Chisty”, and “Rastitelny“ — with different fat contents, packaged in doypacks (stand-up pouches). The Mechta Khozyaiki sauce range was expanded with the arrival of various mayonnaises in original flavours — honey and mustard, barbecue, and garlic (15% fat, weight 200g, doypack). New margarines were also launched for export to Uzbekistan, Tajikistan, Kazakhstan, and Kyrgyzstan: Schedroe Leto for shirchoi (Tajik green tea traditionally made with milk, butter, and salt), 72% fat; Schedroe Leto for puff pastry, 82% fat; Chudesnitsa, 55% fat; and Schedroe Leto Fermerskoye spread, 82% fat.
In response to the growing demand for healthy options in the mayonnaise category, Rusagro has produced light mayonnaises that can be eaten during Orthodox fasts, with packaging marked “no vinegar”, “no starch”, “pure ingredients” and so on. Rusagro launched “Chisty” and “Rastitelny” products under the Ya Lublu Gotovit brand, made of the finest natural ingredients, and sugar- and vinegar-free.
NMGK also has products in its portfolio that support this trend: coconut oil, which contains no cholesterol, for those leading a healthy lifestyle or following keto diets; Ryaba mayonnaise made with natural ingredients, free of artificial additives and GMOs; the Astoria line of sauces with a fat-free base (based on vegetables, fruit, or berries); mayonnaise sauces that contain no animal fats and are thus suitable for Orthodox fasts; and Kremlyovskoye spreads and Khozyayushka clarified fat blends — zero-cholesterol butter and ghee equivalents.
mayonnaise
11.3%
margarine
31.1%
mayo-based sauce
34%
clarified fat blend
78.2%
coconut oil
77.5%
spread
19.8%
Retsepty Chistoty
12.1%
Mayonnaise and sauces
Provansal 40% mayonnaise sauce, the result of a special project commissioned by the food retail chain Magnit, is now the chain’s best-selling product in this category. Special offers in distribution channels to combat the cost-of-living crisis aim to grow sales amid the general fall in incomes and in response to competitors. Launch of new, lower-weight products in order to offer more affordable options. Launch of a revamped line of mayonnaise-based sauces with improved properties for consumers.
Margarines and spreads
Launch of a new line of bulk products (500g — 1kg) for the Central Asian and Russian markets.
Other sauces
Development of a line of non-mayonnaise-based sauces in new flavours — mango, relish, and sweet chilli.
Ketchup
Launch of fast food-style ketchups for X5, Russia’s largest food retail chain, to grow sales.
41% of all industrial products sold by Rusagro’s Oil and Fats segment during the reporting period were exported. At year end, exports totalled 399 thousand tonnes, which is 22% less than in 2022. Exports of vegetable oil and meal were down by 28% (236 thousand tonnes) and 12% (161 thousand tonnes), respectively. Other products saw export growth. The lower figures for the two aforementioned categories are linked to a decline in output. NMGK exported 320 thousand tonnes of similar products, mostly to China.
Meal exports were redirected towards Belarus and China in 2023, and sales to China have increased more than fivefold, reaching 47 thousand tonnes. In another key event, the Company launched sunflower meal on the Iranian market — the first Russian company to do so.
As usual, the bulk of oil exports went to Iran (186 thousand tonnes, −29%) and Turkey (42 thousand tonnes, −24%). One factor in the fall in sales of oil to Turkey was stronger competition from Ukraine, which supplies oil at very low prices. However, the Company has expanded into new markets, namely China and the UAE.


Exports of consumer oil and fat products fell by 11% (−12 thousand tonnes to 103 thousand tonnes) due to a decline in shipments of all the main product categories except mayonnaise and sauces. Exports of consumer margarines and spreads fell by 22% (−7 thousand tonnes) to 27 thousand tonnes. Bottled oil exports were down by 11% (−6 thousand tonnes) to 49 thousand tonnes. However, exports of mayonnaise and mayonnaise-based sauces rose by 5% (+1 thousand tonnes) to 27 thousand tonnes. This was driven by increased demand in key markets — Azerbaijan, Belarus, and Kazakhstan — thanks to the development of distribution channels for Ya Lublu Gotovit mayonnaise, increasing HoReCa sales, and the launch of the Schedroe Leto brand in Kazakhstan.
In addition to oil and fat products, in 2023, as in the previous year, Rusagro exported around 1 thousand tonnes of consumer dairy products.
NMGK’s exports totalled 16.6 thousand tonnes. The main export destinations for mayonnaise and mayonnaise-based sauces were Kazakhstan and Turkmenistan. During the year, NMGK was able to build up its base of regular retail outlets by establishing relationships with new retail chains in Kazakhstan, Georgia, and Kyrgyzstan. Its main destination for margarines and spreads was Tajikistan. The biggest foreign buyers of soap were Kazakhstan, Azerbaijan, and Uzbekistan.

 Other soap products include laundry soap, washing powder, wet wipes, and oleochemicals.
In 2023, the combined Rusagro and NMGK Oil and Fats Business generated RUB 139.9 billion in revenue, an increase of 5% (+RUB 6.6 billion) due to the acquisition of a 50% shareholding in and control over NMGK and the consolidation of results for the second half of the year. This growth was partially offset by a decrease in crude vegetable oil and sunflower meal output due to the temporary shutdown of the Balakovsky Oil Extraction Plant for an upgrade to increase capacity.
Moreover, just under half of revenues (37%) came from exports. Thanks to the synergies that were achieved by combining the businesses, production costs rose at a slower rate than revenues, and this drove the combined business’s profit margin up to 13.4%. As a result, adjusted EBITDA increased year on year by 17% (+RUB 2.7 billion) to RUB 18.7 billion.


business

tonnes
tonnes
tonnes
tonnes
According to data from the Union of Sugar Producers of Russia (Soyuzrossakhar), sugar production for the calendar year 2023 increased by 8% (+518 thousand tonnes) to a total of 6.6 million tonnes. This positive trend in output volume is due to an increase in the production of beet sugar (+745 thousand tonnes). The area planted with sugar beet was increased last year. Favourable weather conditions enabled farmers to increase both the sugar content of the beet and the harvest, which made it possible to process more sugar beet (+9% to a total of 44.4 million tonnes). The carryover stocks from 2022 have increased by 5%, to 3.8 million tonnes.
The 2023 sugar production season began on 1 August and is scheduled to end in the last ten days of March 2024. The season is expected to last 233 days. Based on the results of the 2023/2024 season, sugar production in Russia is expected to increase by 11% to 6.9 million tonnes, including 0.3 million tonnes of sugar produced from molasses. This increase is mainly due to a rise in the volume of beets processed (+12%) to 47 million tonnes, supported by the higher sugar content of the 2023/2024 beet harvest, which according to preliminary data has risen from 16.6% to 17.1%. The carryover stocks from the 2022/23 season are estimated to be around 0.1 million tonnes (−87% compared with the previous season).


At the end of 2023, five companies accounted for 67% of sugar production in Russia. Prodimex is the leading producer, but over the reporting period, its market share fell to 20.5% (−1.1 percentage points). Rusagro is in second place with a market share of 14.8% (+1.3 percentage points). Dominant comes in third with a market share of 14.6% (+0.4 percentage points). The changes in the total sugar production market shares of the companies over the reporting period were due to differences in the volume of the sugar beet harvest in the regions where the companies operate.

Sugar exports from Russia rose by 265% (+504 thousand tonnes) to 694 thousand tonnes in 2023. As a result of increased sugar production and a surplus of sugar on the domestic market, exports to neighbouring countries increased by 252% (+476 thousand tonnes) to 664 thousand tonnes. Supplies to non-CIS countries also rose significantly, totalling 30 thousand tonnes (+28 thousand tonnes, or 1,609%, a 17-fold increase). Kazakhstan is traditionally the largest buyer of Russian sugar: in 2023, the country imported 332 thousand tonnes of sugar (+182 thousand tonnes, or 121%). The second-largest buyer in 2023 was Uzbekistan, which imported no sugar from Russia in the previous two years.
Imports of sugar into Russia fell in 2023 (down by 31%), amounting to 204 thousand tonnes. The main factor here was a decline in raw sugar imports to 19 thousand tonnes due to increased production in Russia. In the previous year, 195 thousand tonnes of raw sugar were imported from abroad (no raw sugar was imported into Russia between 2017 and 2021).

tonnes
tonnes
tonnes
tonnes
tonnes


The average annual price of sugar according to the Krasnodar price index in 2023 was RUB 51.5/kg excluding VAT, 1% higher than the price for the previous year. The upward trend is due to a rise in global raw sugar prices and a weaker rouble, although in the second half of the year this effect was partially offset by expectations of a bumper sugar beet harvest. In December, the market price of sugar was RUB 47.8/ kg, which is 9% higher than for the same month in the previous year.


bn

bn

tonnes

tonnes

Rusagro’s Sugar Business is represented by nine sugar plants located in Tambov, Belgorod, Kursk, and Orel regions, very close to the areas where the Company’s Agriculture Business cultivates sugar beet. In Tambov Region, the Company operates the Znamensky, Nikiforovsky, and Zherdevsky sugar plants; in Belgorod Region, the Chernyansky, Nika, and Valuisky plants; in Kursk Region, the Krivetsky and Kshensky plants; and in Orel Region, the Otradinsky plant.
The maximum sugar beet processing capacity at Rusagro’s plants remained unchanged in 2023, at 53,350 tonnes per day.
The Company can produce approximately 900 thousand tonnes of sugar per season (the period from August to July) depending on the sugar content of the sugar beet, not including sugar production from molasses.
Two main by-products are obtained from sugar beet processing at Rusagro’s plants: pulp and molasses. The plants process the pulp into granules and sell it on to third-party companies, while the molasses is used to produce betaine and additional sugar. The Company operates two desugarisation lines at the Znamensky and Chernyansky sugar plants, with a total combined processing capacity of 327 thousand tonnes of molasses per season. A 4% increase in capacity was achieved last year due to greater efficiency of operations and a reduction in downtime for scheduled preventative maintenance work, which resulted in an additional 12 thousand tonnes being processed during the year. The desugarisation lines make it possible to produce up to an additional 120 thousand tonnes of sugar and 30 thousand tonnes of betaine per year, making Rusagro a world leader in the production of this amino acid.
The Company’s assets include the Gerkules JSC cereal plant, which is a grain processing enterprise with its own packaging line. Buckwheat grain and crushed buckwheat are produced at the plant for B2B sales, while packaged buckwheat and rice are produced for the B2C channel.


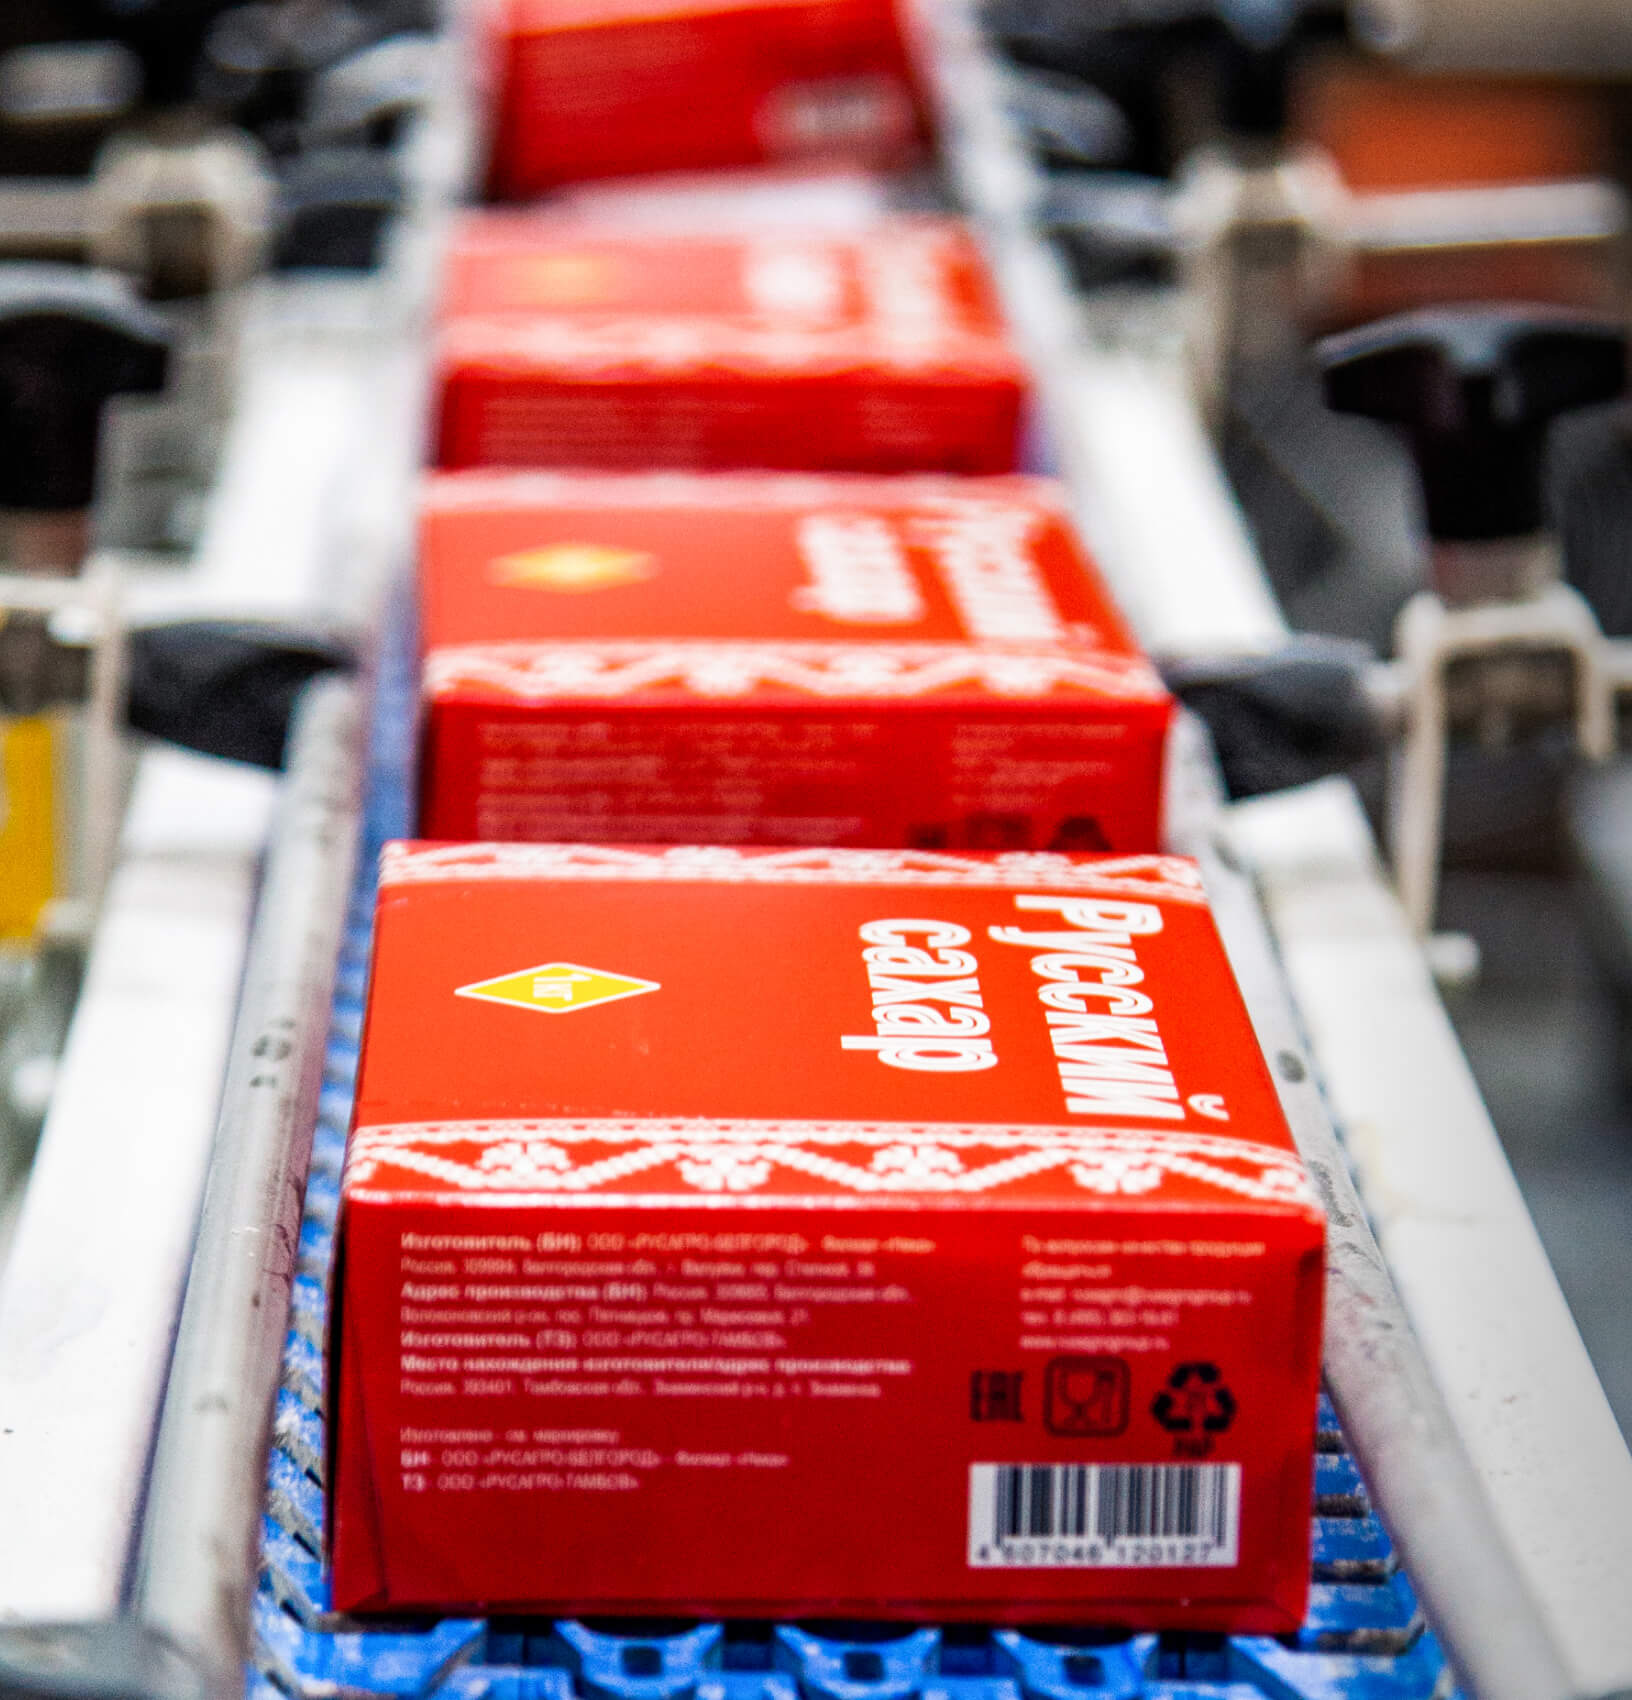
The Company’s product portfolio includes five sugar brands in different price categories: Russkii Sakhar, Chaikofsky, Brauni, Mon Cafe, and Khoroshy, as well as the Tyoplye Traditsii brand, which includes both cereal and sugar. The Company has consistently led the consumer sugar market over the years, with the Russkii Sakhar, Chaikofsky, Brauni, and Mon Cafe brands occupying the top market positions in their respective segments. Its sugar brands are also the most popular with Russian consumers: the Russkii Sakhar and Chaikofsky trademarks show consistently high levels of brand awareness and brand loyalty.


In 2023, Rusagro invested RUB 2 billion in developing and maintaining its Sugar Business, an increase of 66% on the previous year. According to the results for the reporting period, approximately 55% of this investment was directed towards maintaining the existing capacities of the Sugar Business: overhauling or replacing equipment, upgrading production facilities, and increasing the reliability of operational processes. The remaining funds were spent on development, specifically on improving raw and finished product quality, automation, reducing production losses and fuel (gas) consumption, and process optimisation.

- Znamensky plant
- Nikiforovsky plant
- Zherdevsky plant
- Nika plant
- Krivetsky plant
- Otradinsky plant
bn


bn
- Kshensky plant
- Krivetsky plant
- Otradinsky plant
- Znamensky plant
- Nikiforovsky plant
- Chernyansky plant
- Zherdevsky plant
- Nika plant

bn
In addition to our process-related projects, Rusagro’s Sugar Business is exploring the possibility of extracting additional profit from the processing of by-products created at different stages of the production cycle. In 2023, the Company started selling compound feed additives based on sugar beet pulp and various types of molasses.
Among other things, the Company is exploring opportunities to extract additional profit from raffinate. In 2023, research was carried out on raffinate electrodialysis, and work on pyrolysis and raffinate combustion is planned for 2024, with the principal goal of obtaining potash fertilisers. Tests on raffinate as a feed additive for livestock feed are also planned for 2024.


production


In 2023, the volume of sugar beet processed by Rusagro’s plants rose by a record 20% to 5.7 million tonnes. This figure includes 4 million tonnes of raw materials grown and supplied by the Company’s own Agriculture Business. In total, by the end of the season that commenced in late August 2023, the Company had processed 6.6 million tonnes of sugar beet, including 4.7 million tonnes of sugar beet harvested by the Company, its biggest-ever harvest and 29% more than the previous season. This was due to increases in both the area planted and the sugar beet yield.
Results for 2023 indicate that the sugar content of the sugar beet on arrival was 17% (excluding sugar output from molasses)Sugar content as a percentage., which did not break any records, being 0.6 percentage points lower than in the previous year.
All in all, Rusagro produced 925 thousand tonnes of sugar in 2023, a record since 2018 and 20% more (+155 thousand tonnes) than in the previous year. This includes 118 thousand tonnes (+1%) of sugar from molasses obtained from the 2022/2023 sugar beet processing season, including molasses sourced elsewhere. The Company also produced 224 thousand tonnes of sugar (+15%) from outsourced sugar beet purchased from farmers.
Over the course of the 2023/2024 season, the Company plans to produce 903 thousand tonnes of sugar, 33% (+224 thousand tonnes) more than the previous season, not including sugar produced from molasses, since there are more sugar beet stocks available.


In 2023, Rusagro increased sugar sales significantly: by 25% (+214 thousand tonnes) to 1,067 thousand tonnes. This growth was largely achieved by increasing sugar production, developing sales through key channels, and improving export sales. In addition to sugar, the Company sold 277 thousand tonnes of pulp (+46%), where the growth in sales was also due to an increase in production volumes, 45 thousand tonnes of raffinate (−35%), 32 thousand tonnes of betaine (+21%), and 5 thousand tonnes of cereals (−37%). The molasses produced was used internally to produce additional sugar, and the filter cake is used as fertiliser for the Company’s own soil treatment requirements.


Rusagro exported 359 thousand tonnes of products in 2023, 90% more than the previous year and the largest export sales volume in the Company’s entire history. The main export product for the Sugar Business in terms of volume had previously been pulp, but in 2023 the Company succeeded in increasing its sugar exports nearly tenfold, bringing them to 126 thousand tonnes (+875%). This volume of exports is a record for the Company. The main buyers were from CIS countries.
This surge in export sales was achieved by launching a project focusing on the production and sale of raw sugar for export, and also by opening up new export markets and strengthening the Company’s position on existing markets. Pulp exports in the reporting period increased to 202 thousand tonnes (+34%). This growth is due to an increase in production and a change in pricing in export areas.
Despite the inclusion of pulp in the European Union sanctions package in June 2022, the Company has been able not only to successfully refocus its exports, but also to increase them. The United Arab Emirates has become the largest export market for pulp. Almost all our betaine, 31 thousand tonnes (+22%), was exported.

In 2023, the consumer market segment accounted for 20% of sugar sales by volume and 22% of sugar sales revenue. Although the B2C segment’s share of overall sales volumes is slightly down due to the rapid growth of the B2B segment (which has overtaken it with a share of 27%), B2C sales volumes nevertheless rose by 16%, which is a significant breakthrough given the highly competitive market. The increase in B2C sales in 2023 was linked to the development of sales of packaged sugar, primarily for key customers, and an increased share of 55% in the sugar cube category (up 4 percentage points on last year). The growth of sales in the B2B segment was largely due to industrial customers and exports.
Own-brand sugar sales totalled 140 thousand tonnes, which is 12% less than in 2022. For the reporting period, the Russkii Sakhar and Chaikofsky brands continued to occupy first and second places in the Russian white cube sugar market, while Brauni again led the brown cube sugar market.
The product range was expanded during the reporting period by the market launch of two new types of biscuits (Chaikofsky butter cookies with chocolate and Chaikofsky butter cookies with cranberries).
According to research carried out by AC Nielsen, as of December 2023, the share of the white cube sugar market occupied by the five Rusagro sugar brands — Russkii Sakhar, Chaikofsky, Mon Cafe, Khoroshy, and Tyoplye Traditsii — totalled 55% (+4 percentage points).Market share is calculated based on annual averages. Meanwhile, Brauni accounted for 23% (−11 percentage points) of the brown cube sugar market in Russia.
According to data from Tiburon, the Russkii Sakhar and Chaikofsky brands again showed a high level of brand recognition in 2023: 85% for Russkii Sakhar and 61% for Chaikofsky. These figures have hardly changed for three years in a row. Brand loyalty has risen to 50% for Russkii Sakhar (+2 percentage points) and 25% (+4 percentage points) for Chaikofsky over the year.
tonnes
In 2023, the revenue from Rusagro’s Sugar segment increased by 31% to RUB 64.8 billion (+RUB 15.2 billion). This is the result of a rise in the average annual selling price of sugar, as well as a 25% increase in sales. Adjusted EBITDA rose by 22% to RUB 19.2 billion (+RUB 3.5 billion). The adjusted EBITDA margin for the Rusagro Sugar segment stood at 30%, which is 2 percentage points lower than in 2022.

bn
bn


Business

tonnes
tonnes
tonnes
In 2023, pork production increased by 5% (+236 thousand tonnes)The equivalent of 6.1 million tonnes in live weight. to 4.8 million tonnes in slaughter weight. Agricultural enterprises increased their output by 7% (+281 thousand tonnes), while peasant farm enterprises and private farm households reported another a significant drop in production (down by 11%, or 45 thousand tonnes). The increase in pork output in Russia has been made possible by the expanded production capacity of key market players.
tonnes

In 2023, the seven largest pork producers in Russia accounted for 44% of the country’s total production. Miratorg Agricultural Holding retains its place as the market leader. Following the opening of new facilities, the company was able to increase output by 139 thousand tonnes of live weight (up by 21%) and take 13.3% (+1.7 percentage points) of the pork market, producing a total of 804 thousand tonnes of pork in live weight. JSC Sibagro retains second place for the third year in a row with an estimated share of 6.2% (−0.5 percentage points). Its annual production fell to 378 thousand tonnes (−10 thousand tonnes). Rusagro retains third place in the 2023 ranking of producers, with production volumes of 334 thousand tonnes, a drop of just 2 thousand tonnes from 2022. The company’s share of the market stands at 5.5% (−0.3 percentage points). The gap between Rusagro and second-ranked JSC Sibagro fell to 44 thousand tonnes.

In 2023, Russian exports of pork (half carcasses, large cuts, industrial cuts, and semi-finished products) and pork by-products increased by 34% from 2022 to 220 thousand tonnes (+56 thousand tonnes). Since the Company has adapted to the current conditions and addressed logistics, insurance, and payment issues, volumes have not only recovered to 2020–2021 levels, but exceeded them.
Vietnam remains our key buyer outside the CIS, with a 75% share of exports to non-CIS countries (39% of all exports). Russia is the second biggest exporter to Vietnam, accounting for 30% of the country’s imports. The EU remains the leader at 42%, with Brazil in third place at 18%. An increase in domestic production and low purchasing power prevented the Company from increasing pork exports to Vietnam.
Other non-CIS recipients of Rusagro meat exports include:
Serbia (9.6 thousand tonnes), where imports from Russia tripled following reorientation towards Russian suppliers thanks to lower prices compared to the EU following ASF outbreaks in Europe.
Mongolia (9.2 thousand tonnes), where half carcasses from producers with facilities in the Urals and Siberia accounted for a quarter of all imports.
Hong Kong, where the Company saw a 90% increase in exports compared to 2022. However, volumes remained low relative to previous periods, with recovery hampered by the ongoing difficulties of re-exporting products to Asian countries and certain provinces of China (Taiwan, Macau).
Over the last few years, domestic production has increased and pork imports to Russia have remained low. The abolition of quotas on duty-free imports of frozen pork, the weakening of the rouble, and the growth of domestic production have practically eliminated imports. Pork prices on the Russian market are among the lowest in the world.


bn
Meat segment
bn
Meat segment
tonnes
tonnes
Rusagro’s meat segment consists of three vertically integrated clusters: two in Central Russia, in the Tambov and Belgorod regions, and one in the Primorsky Territory in Russia’s Far East. The Primorsky Territory cluster came online in 2021.
Each cluster comprises its own pig breeding farms, livestock rearing sites, a compound feed mill, a slaughterhouse and meat processing plant, and a slaughterhouse waste recycling plant.

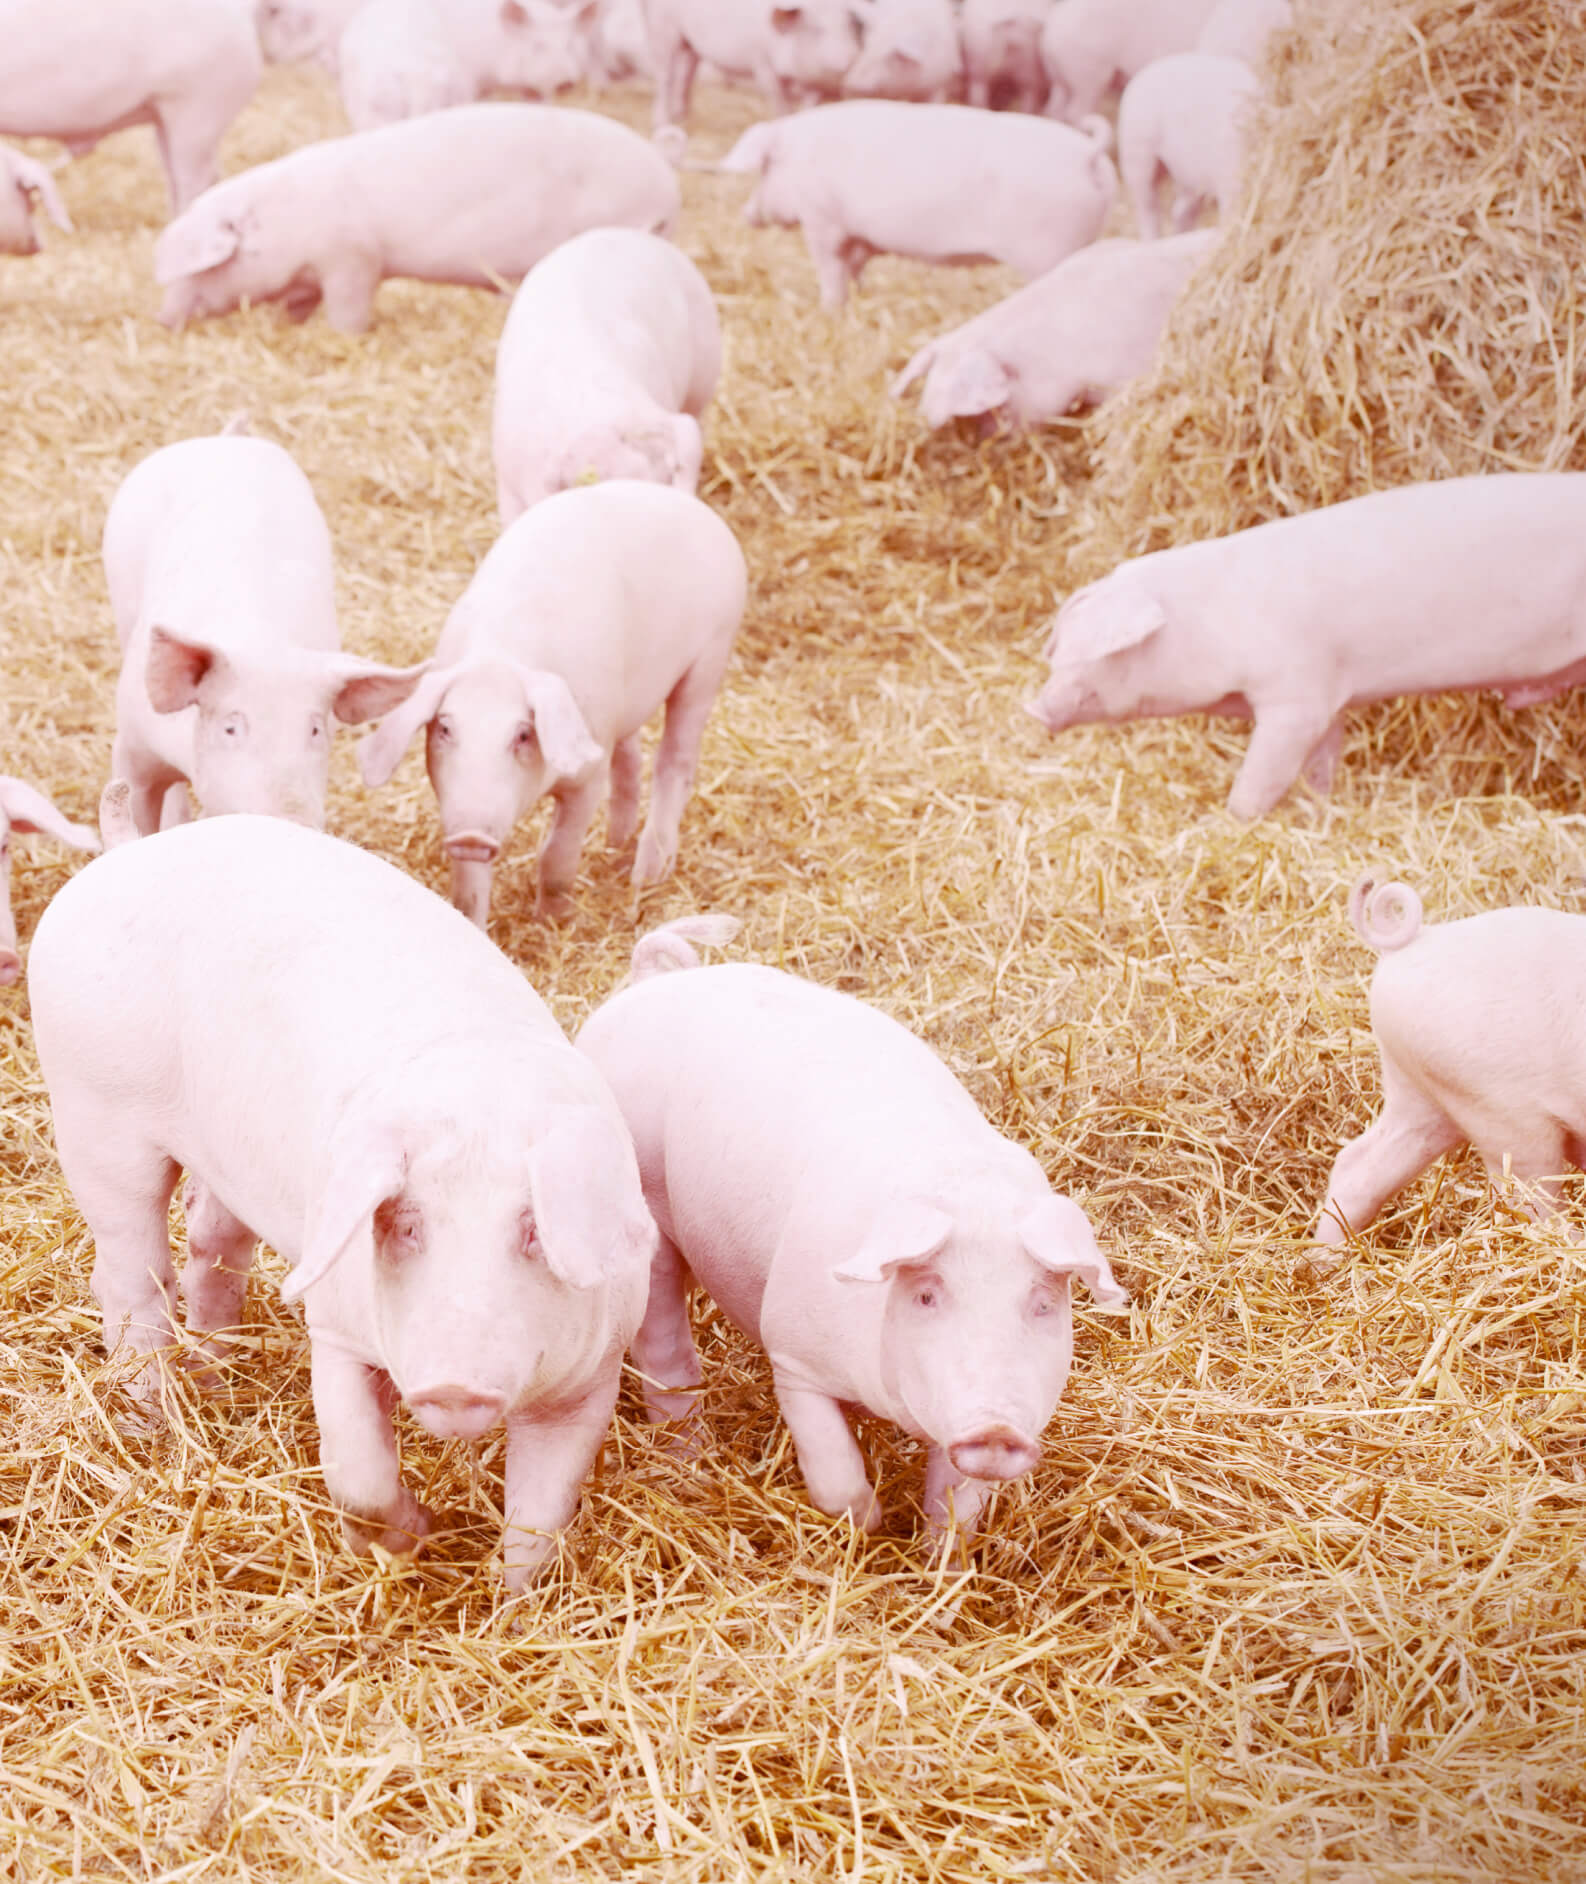
Rusagro has 26 commercial pig breeding complexes and six breeding farms to replenish the herd. At the end of 2023, there were a total of 118 thousand breeding sows. Two new facilities were opened last year.
The Company’s pig farms operate to international standards, employing the latest science and technology in pig breeding and feeding. Our production sites are up-to-date, highly automated, and environmentally friendly. Each complex pays particular attention to compliance with biosafety requirements and operates a manure removal and waste disposal system.

Livestock feed demands are met by three Rusagro feed mills with an annual production capacity of more than 1.5 million tonnes: 1 million tonnes in Central Russia and 0.5 million tonnes in Primorsky Territory. The modernisation of the feed mill in Belgorod Region was completed in 2023, increasing capacity from 12 to 20 tonnes per hour and enabling our Belgorod Region operation to become fully self-sufficient in feed. In October 2023, the Rusagro-Primorye plant began selling its feed on the foreign market.
Our mills have granulated animal feed production lines in place for all processing cycles. Production technology laboratories conduct highly accurate chemical, technical, and bacteriological analysis.
Feed elevator storage capacity in 2023 totalled 280 thousand tonnes, including 120 thousand tonnes in Primorsky Territory. The Meat Business also possesses grain storage sleeves with a total capacity of 380 thousand tonnes combined. With its own storage facilities, the Company can purchase ingredients at a time that best suits its needs and when prices are low.

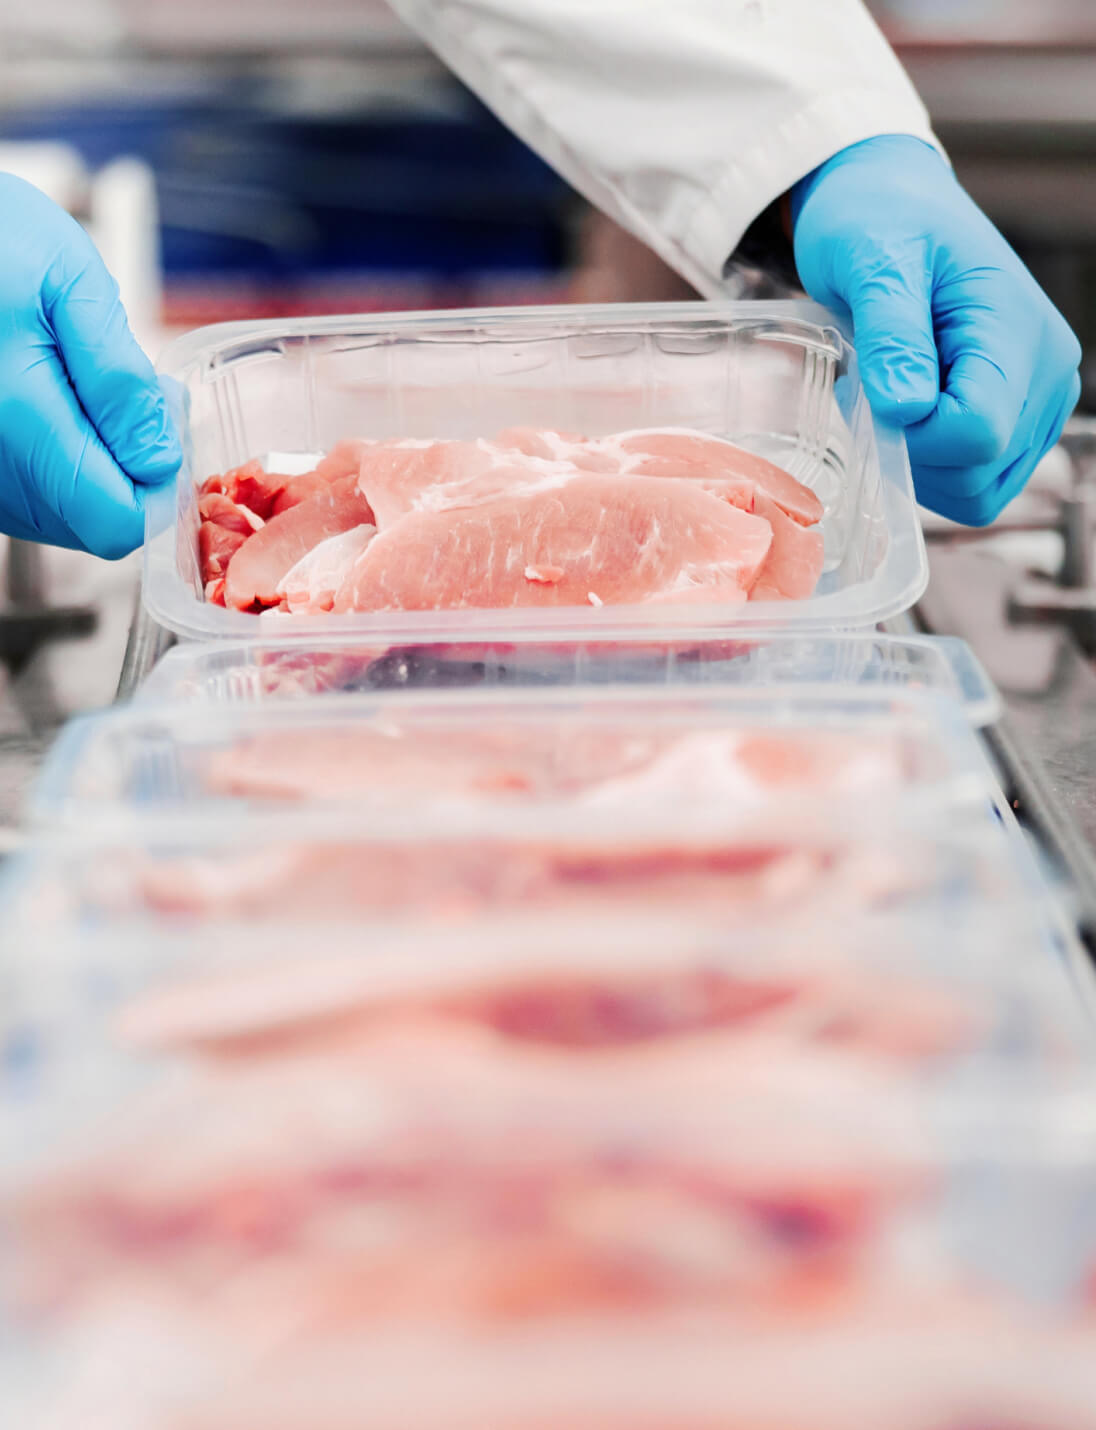
Rusagro’s slaughterhouse and meat processing plants cover all stages in the processing and production of finished goods: a slaughter line, a deboning station, a chilled semi-finished products station, an offal processing station, and a waste processing station. In 2023, slaughtering capacity increased by 1% to 765 heads per hour, whilst deboning capacity also increased by 1% to 607 heads per hour due to higher productivity in the Primorsky Territory cluster.
The products fall into four main categories: half carcasses, large and small cuts, chilled semi-finished pork products, and offal. All our sites have a food safety management system in place to drive down risks at every stage of production. We observe strict compliance with the technical regulations governing meat safety. The largest percentage of animals sent to slaughter in 2023 came from the Company’s own pig farms (97% compared to 95% in 2022).
The waste processing station ensures that slaughter and deboning waste is thoroughly processed. Blood meal is produced from blood; offcuts from the carcasses of culled animals ; and from bones and defective products we produce meat and bone meal and feed or industrial fat. Some of these products go into feed production, and some are sold to other companies.


Rusagro has been selling meat products under its own trademark, Slovo Myasnika, since 2016. Over the past six years, the Company has achieved high levels of brand recognition and ensured the steady growth of market share and consumer loyalty in its category. The increase in market share last year is due to the growth of the brand in the minced meat, ready-to-cook raw meat product , marinade, and large cut categories. The brand increased awareness and loyalty through trade marketing and regular TV and online advertising.
The brand’s key successes include improving product quality, increasing distribution in value-added categories (minced meat, ready-to-cook raw meat products, marinades), launching more than 12 new products, and becoming No. 1 in e-commerce sales.
The brand’s extensive product range is regularly reviewed to meet changing market needs. In 2023, new products were launched in the grill category (“Nezhniye” sausages, “Ispanskiye” ribs), ready-to-cook raw meat category (“Slivochniye” and “Tri myasa” cutlets), marinade category (“Barbekyu” ribs in berry sauce, ribs with currants, “Prazdnichny” pork loin, “Nezhny” pork leg, pork shoulder in a sweet and sour marinade, country-style roast, “Domashnee” roast with mushrooms), and mince category (“Tambovsky Premium”). In addition, Rusagro is developing its range of healthy food options. The brand’s product range includes products that can be steamed (cutlets, meatballs), as well as products for roasting in the oven (our range of marinaded products).

In 2023, the meat processing plant in Primorsky Territory underwent a product quality and safety inspection by Mars, a major producer of long-life products. During the inspection, auditors checked the quality and safety of meat and bone meal production, scrutinising the plant’s production process, organisational and technological elements, and the production control system.
The inspectors praised the team, including the food engineers, the quality control department, and the production staff, for their high levels of professionalism and expertise.
They also noted the cleanliness of the meat processing plant and semi-finished products shop. Following this successful client audit, Rusagro will arrange its first deliveries of meat and bone meal to Mars for the production of pet food.

In 2023, Rusagro’s investment in its Meat Business totalled RUB 4.4 billion, up 8% on the previous year. The bulk of these funds were allocated to business development, primarily in connection with the completion of the investment phase of the project to create a vertically integrated cluster in Primorsky Territory, and also with the expansion of deboning capacity to 4,900 carcasses per day and construction of a frozen product warehouse in Tambov Region.
Funds intended to underpin the existing capacity of the Meat Business were spent on introducing a comprehensive enterprise resource planning (ERP) system, replacing the floor joists at our sites to reduce animal injuries, and replacing water towers in Belgorod Region.

highlights

of 450 ths tonnes

bn

bn

bn
bn
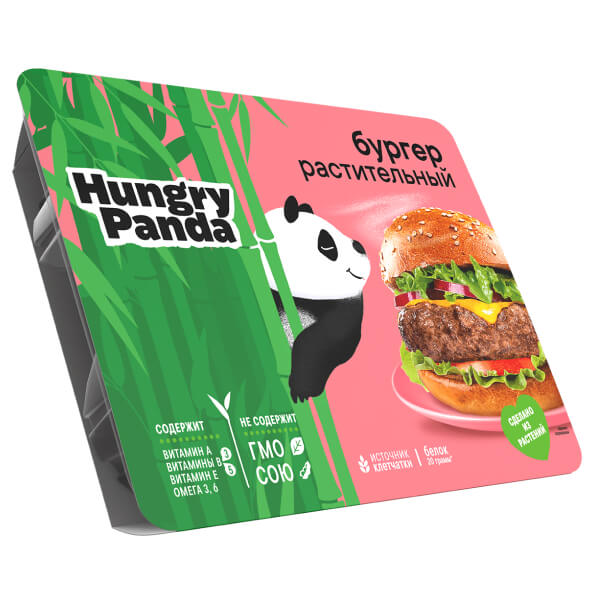
Rusagro’s Meat Business continuously implements projects to increase production capacity and expand our product range, and considers and develops opportunities for generating additional profit from the processing of by-products. In 2023, our R&D team worked to find a waste processing solution at a biogas plant to produce electricity and organic fertiliser. The production of vegetarian meat substitute based on hypoallergenic pea protein has been launched under the Hungry Panda brand. Innovative approaches were taken to increase piglet immunity by having them drink Chlorella suspension.

In 2023, Rusagro’s marketable livestock increased by 1% (+40 thousand heads) to 2.8 million heads. Marketable pork production totalled 334 thousand tonnes, which is 2 thousand tonnes (−1%) down on the previous year. The increase in marketable livestock sales was due to the launch and ramp up of production at the Belgorod Region site, where Rusagro produced 124 thousand tonnes of live weight pork. This increase was partially offset by preventive measures taken against infectious diseases at several pig farms in Primorsky Territory.
In the reporting period, the production of marketable livestock for slaughter fell by 1% (−23 thousand heads) to 2.7 million heads due to a shortage of third-party livestock on the market in Tambov Region. Almost all the livestock delivered for slaughter (97%) came from our own production sites. This positive trend is also noted in relation to deboned livestock, whose numbers increased by 8% to 2 million head, up 150 thousand head on 2022.
Feed production in 2023 fell by 7% (−72 thousand tonnes) to 920 thousand tonnes due to external reasons, including: short-term shutdowns at the feed mill in Shebekino due to risks associated with the proximity to military action, and lower demand for feed in Primorye.


Sales remained almost unchanged last year, decreasing only slightly. The Meat segment sold 290 thousand tonnes of pork products (−1%), including 264 thousand tonnes of products from the meat processing plant (−0.4%) and 25 thousand tonnes of live pigs (−10%). Sales of large cuts (+3%, or 3 thousand tonnes), offal (+10%, or 3 thousand tonnes), and semi-finished products (+30%, or 10 thousand tonnes) increased due to the ramping up of production in Primorsky Territory to full capacity, the growth of offal sales for export, and progress in the development of the semi-finished product category. In 2023, product sales at the waste processing station decreased slightly (by 8%, or −1 thousand tonnes).

tonnes

As part of its strategy for penetrating the retail market, Rusagro continued to refine the position of its Slovo Myasnika brand of meat products in the Russian marketplace. Sales of own brand products increased by 36% to 37 thousand tonnes. According to sales analytics, at Ntech (Novye tekhnologii) retail chain outlets, the market share of the Slovo Myasnika brand in the branded chilled pork category grew by 1.5 percentage points to 14.2% in 2023.
According to Millward Brown, brand awareness (with a prompt) in the Central Federal District stood at 88% (unchanged from last year), and 75% across Russia (+1.4 percentage points). Last year’s position was maintained and brand awareness and brand health indicators increased slightly due to the effective implementation of a regional TV campaign in the key regions where the Company operates. The growth in brand loyalty from 8% to 9% was achieved thanks to improved consumer appeal and scaled up distribution.
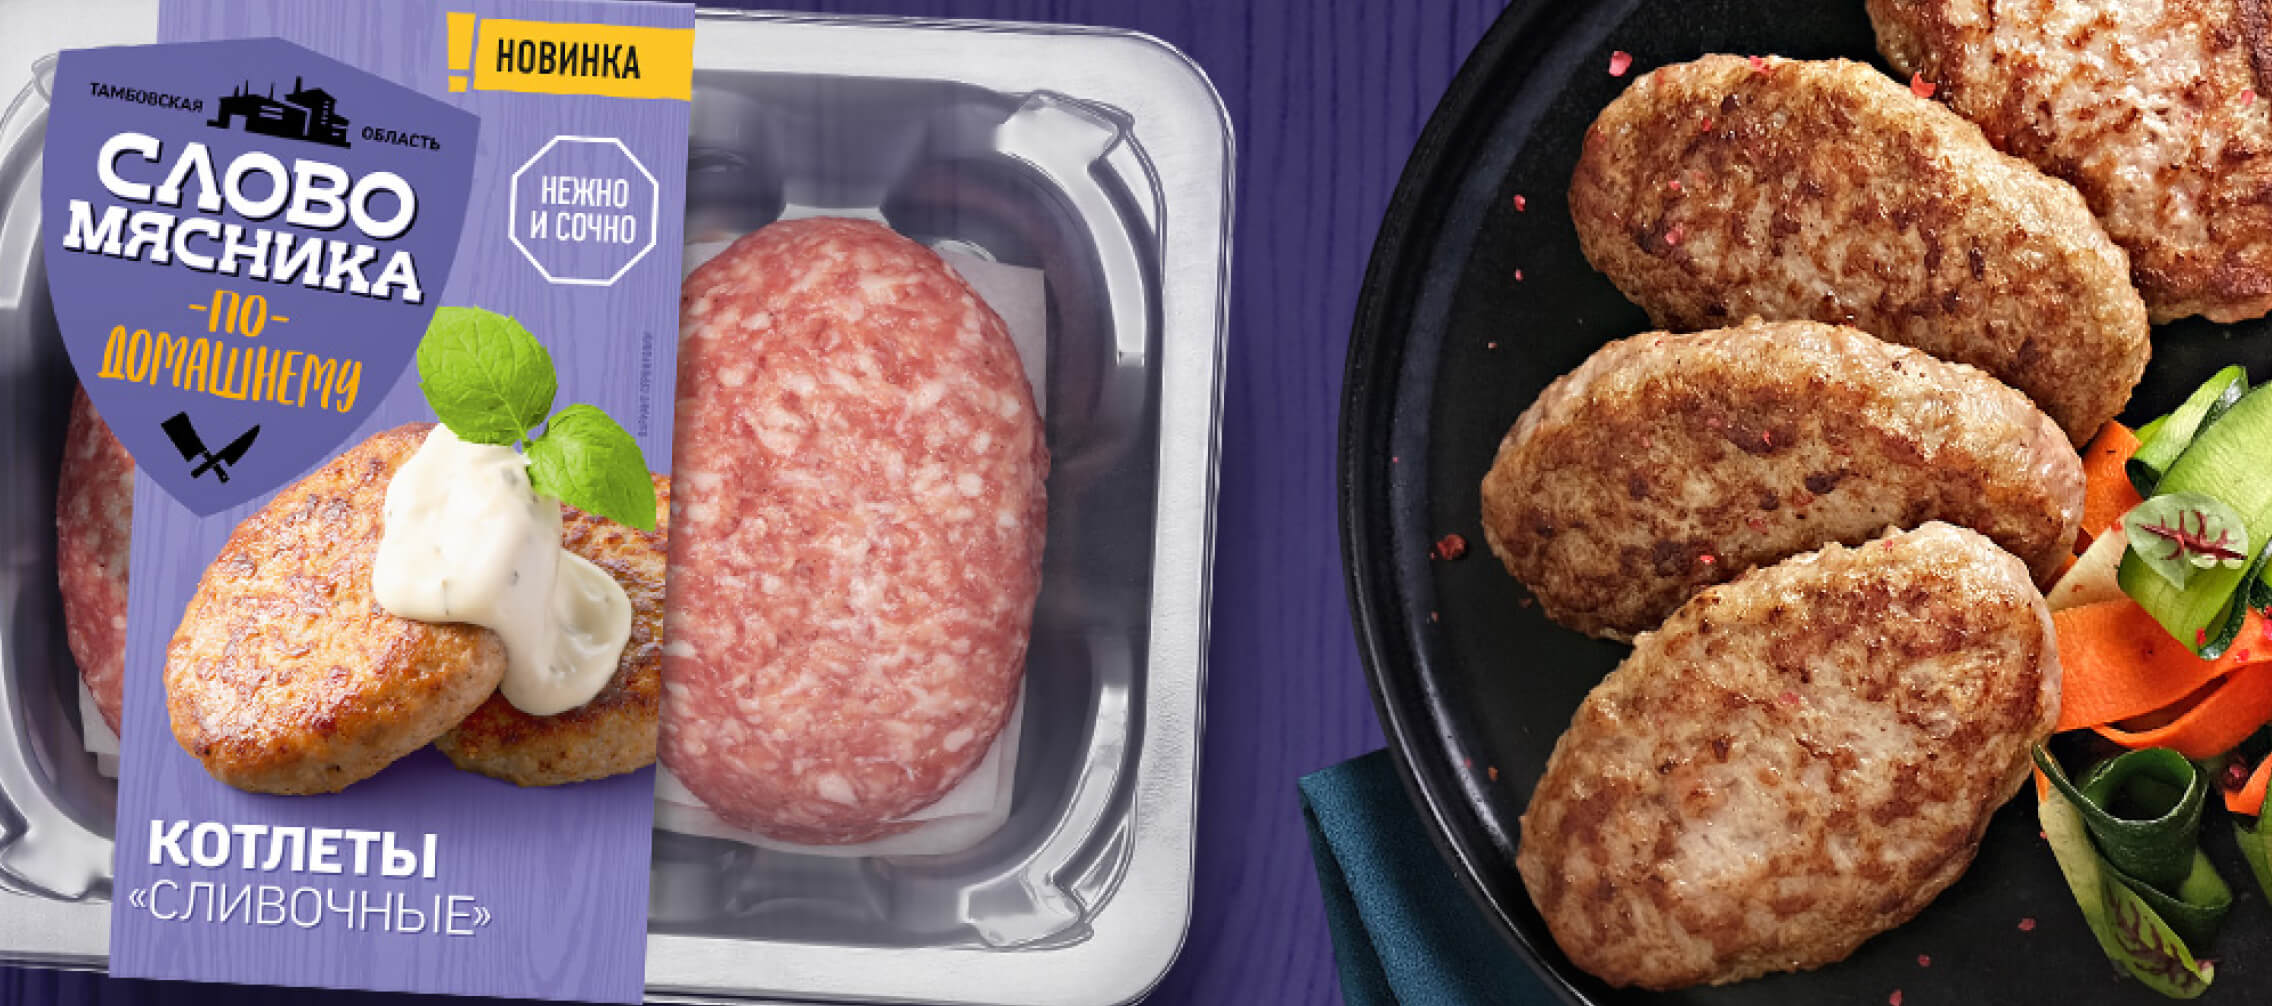
In 2023, Rusagro reduced exports of meat products by 39% to 26 thousand tonnes (−17 thousand tonnes), which is 10% of the meat products sold by the Company. The decrease was due to difficulties procuring livestock in the Central Region. In addition, exports were partially redirected to the domestic market to meet demand. The bulk of exports (79%) fell into the large and industrial cuts category. The second largest export category (13%) was offal. The main destination for pork products was Belarus, which accounted for 78% of total sales (20 thousand tonnes), while 19% (5 thousand tonnes) went to Vietnam. Exports to Vietnam grew by 2.7 times, year on year. The reporting period is characterised by successful collaboration with Belarus and Vietnam, our main non-CIS buyer, which was made possible due to the renewal of logistics infrastructure.


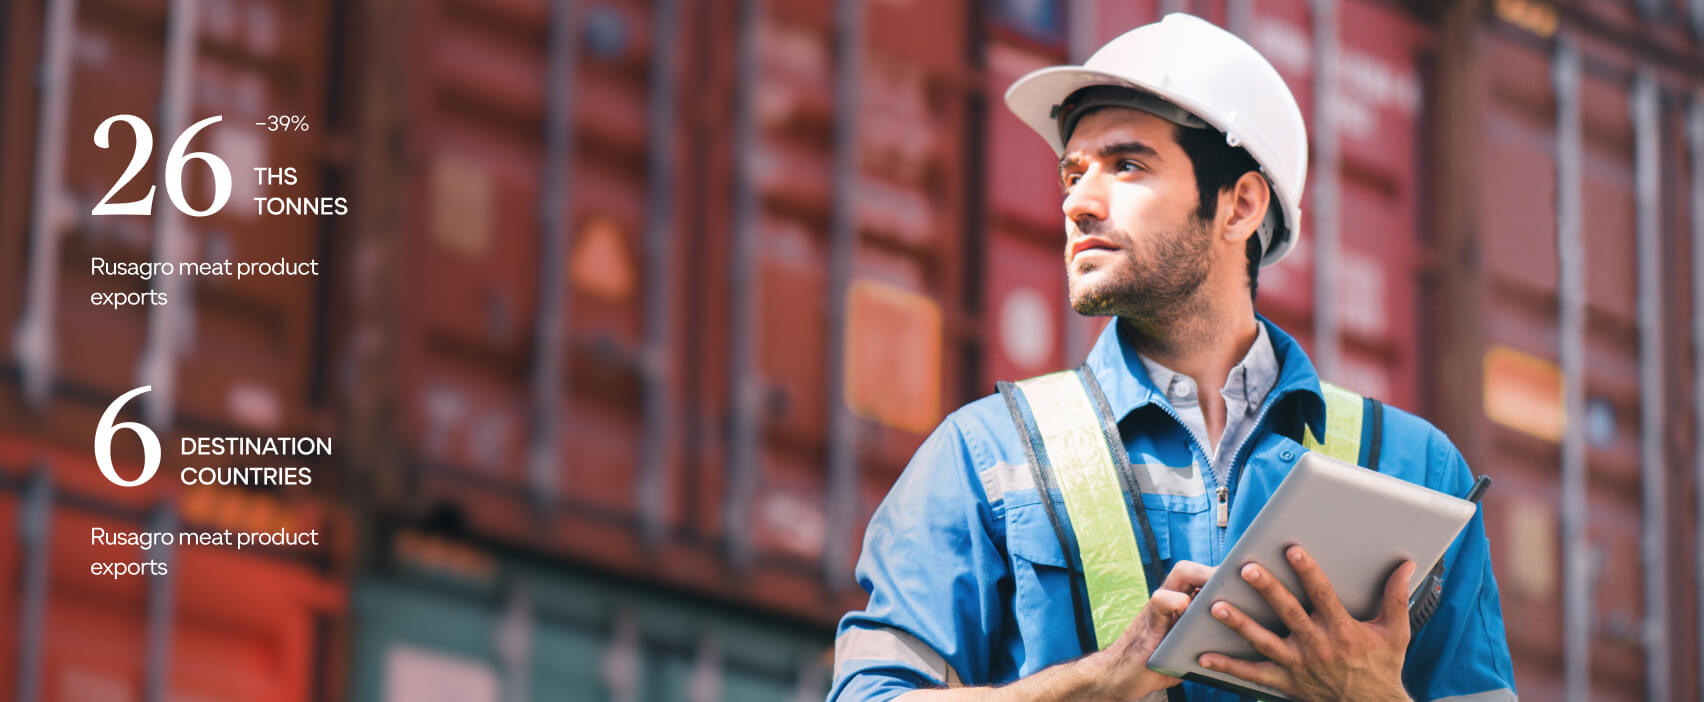
As a result of increased sales of pork products in 2023, Rusagro’s Meat segment revenues increased by 11% to RUB 48.5 billion (+RUB 4.8 billion), including RUB 5.1 billion from export operations. The adjusted EBITDA margin grew from 4% to 10% on the back of the launch and ramp-up of the pig-breeding cluster in Primorsky Territory. As a result, compared to 2022, adjusted EBITDA more than tripled to hit RUB 5 billion.

